
Making The Most Of The AdWords Dimensions Tab
by John Thuet • December 4, 2014


The AdWords Dimensions Tab can help bring your PPC optimization out of this world
AdWords, like most Google products and services, has many facets that are designed to help you get a better look into your data to make educated decisions. Sometimes to dive deeper, you may need to know a thing or two about AdWords. Here are a few of my favorite aspects of how to make the most of the AdWords dimensions tab:
Time:
As you can see from the image below, the dropdown “view” button will allow you to breakdown and fully utilize the AdWords dimensions tab when selected. One of the first things I’ll do with an account that has a few months of data is hop into the “week” or “day” view in order to take a look at how the account is performing in comparison to other weeks or days.
This data can be invaluable to an account. It can tell you how you are doing and break it down by the time period that makes sense to you. For example, I may never want to run my campaigns on Wednesdays, since the breakdown of previous data in the “day” view is telling me that Wednesdays are my worst converting days of the week!
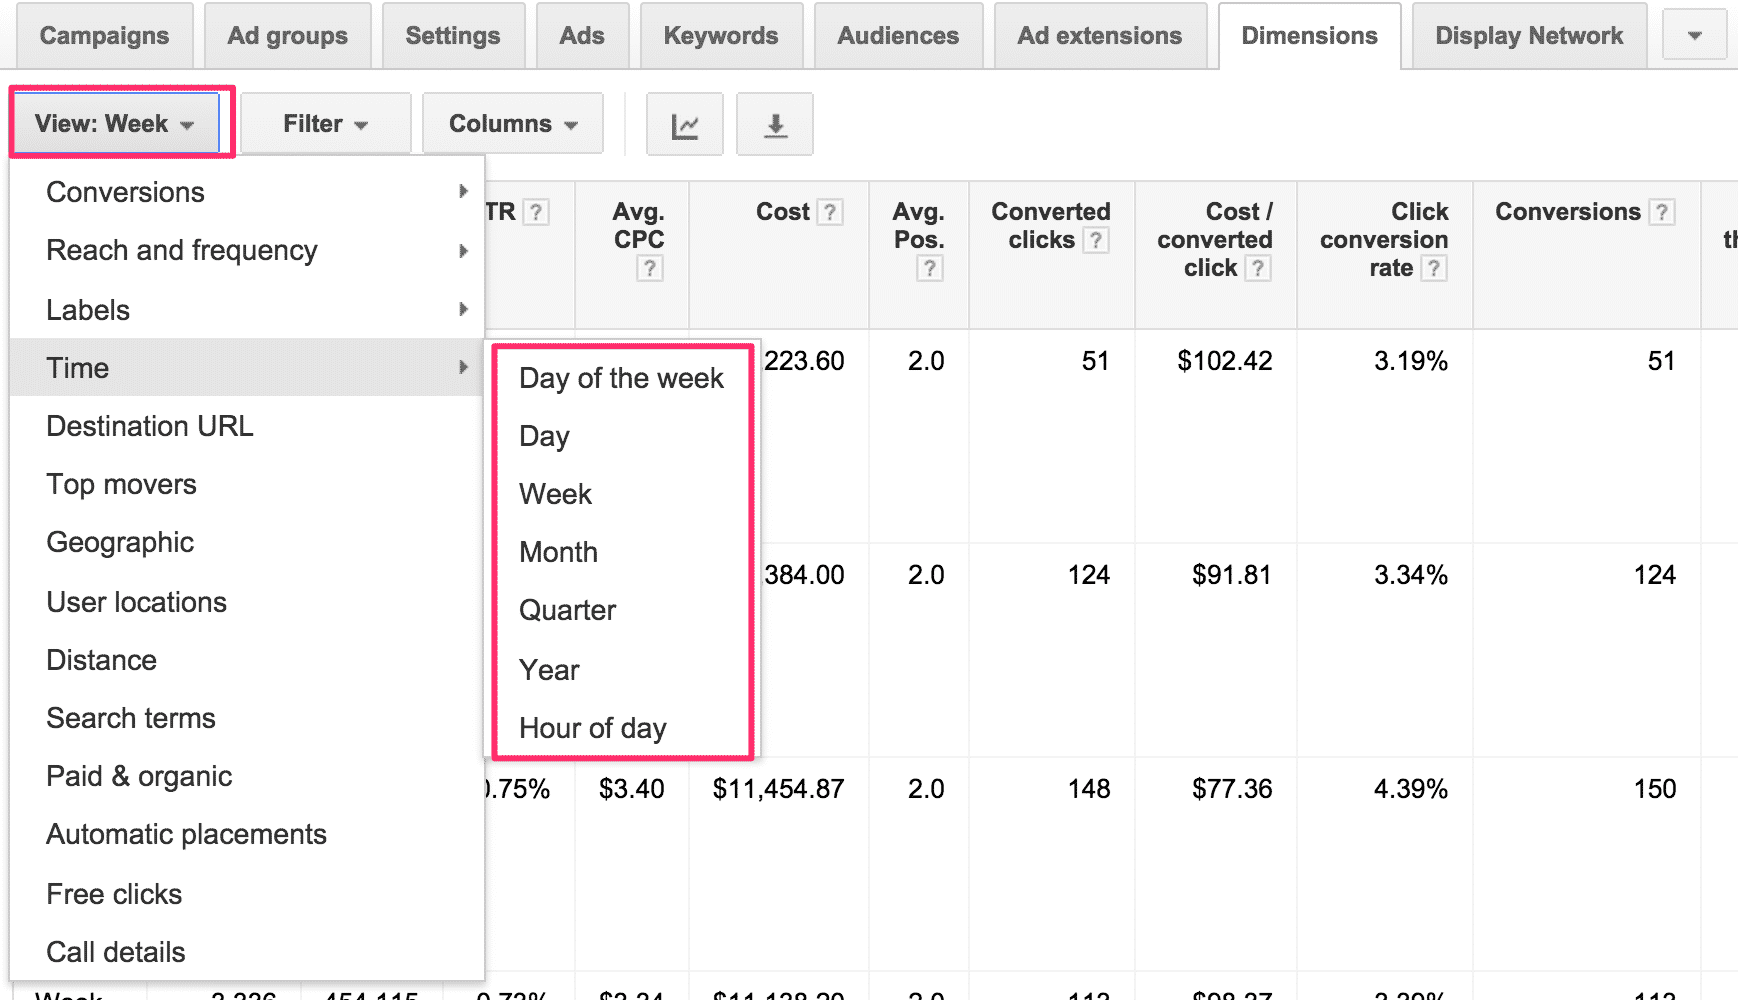
The “View” dropdown has a ton of intel for you to use
I also like to take a look at the “week” view in order to see how my campaigns have progressed week over week and this view allows me to quickly compare all of my columns instead of just a few in the typical graph view that I’m sure you’re accustomed to.
Below is a look at how that view can be organized: (Note: Just like in almost any view within AdWords, you can simply click on one of the columns of data to sort it for your own purposes. Ex: you may want to sort by average position or cost/converted clicks. To do that, simply click on the desired column and it will organize the data accordingly).
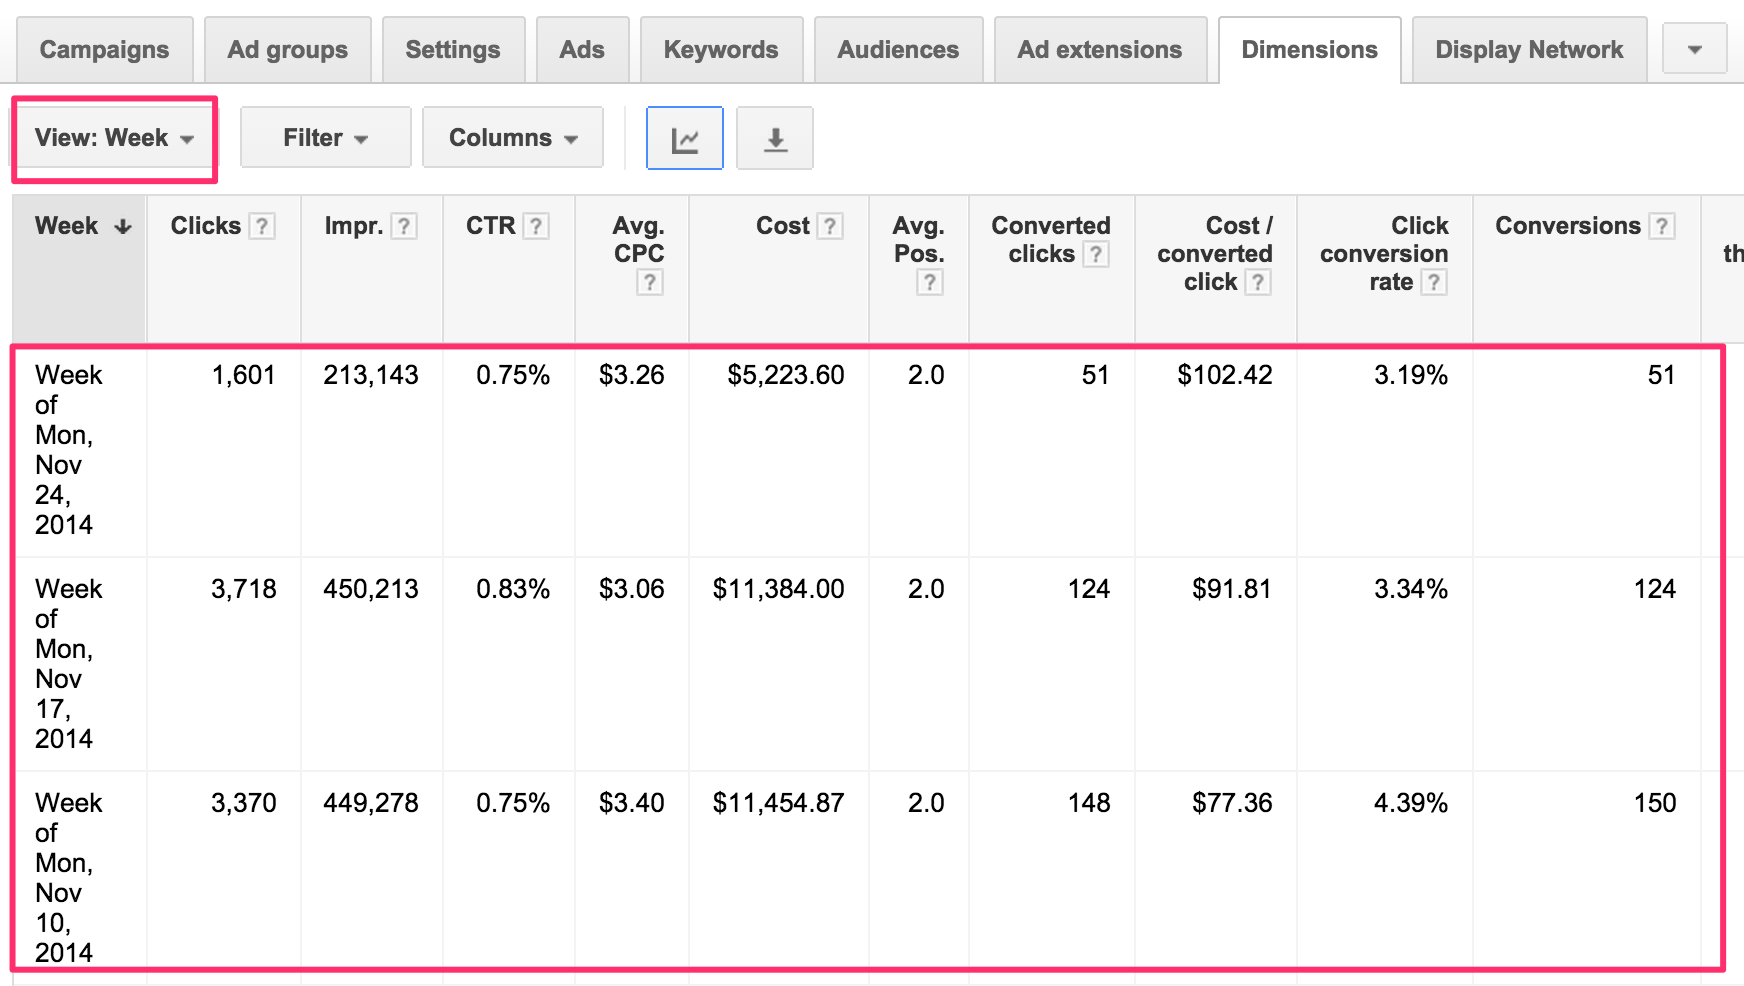
Go to your dimensions tab, then view the time period you’re interested in
As we are on the subject of time and breaking the data down by week and by day, there is even a selection to break things down by the hour. I have yet to encounter a campaign where that data isn’t useful for the client to have. If I take a look at the data and see that my campaign performs best from 6am – 2pm and then not so good from 2pm – 6pm, then I’m going to adjust my bidding/budget strategy around that data.
Obviously this data is a piece of cake to review for an e-commerce account, but lead gen can prove to be a bit more difficult. However, all that is required is a bit of feedback from the client. If you notice you are getting leads in at 2am, make sure your client is able to contact and close those leads at a rate that makes sense for them.
Just because leads convert super well during a particular hour of the day, it doesn’t mean they are necessarily the best quality of lead. Have a good lead quality assurance check system in place and then this breakdown by the hour will prove very helpful.
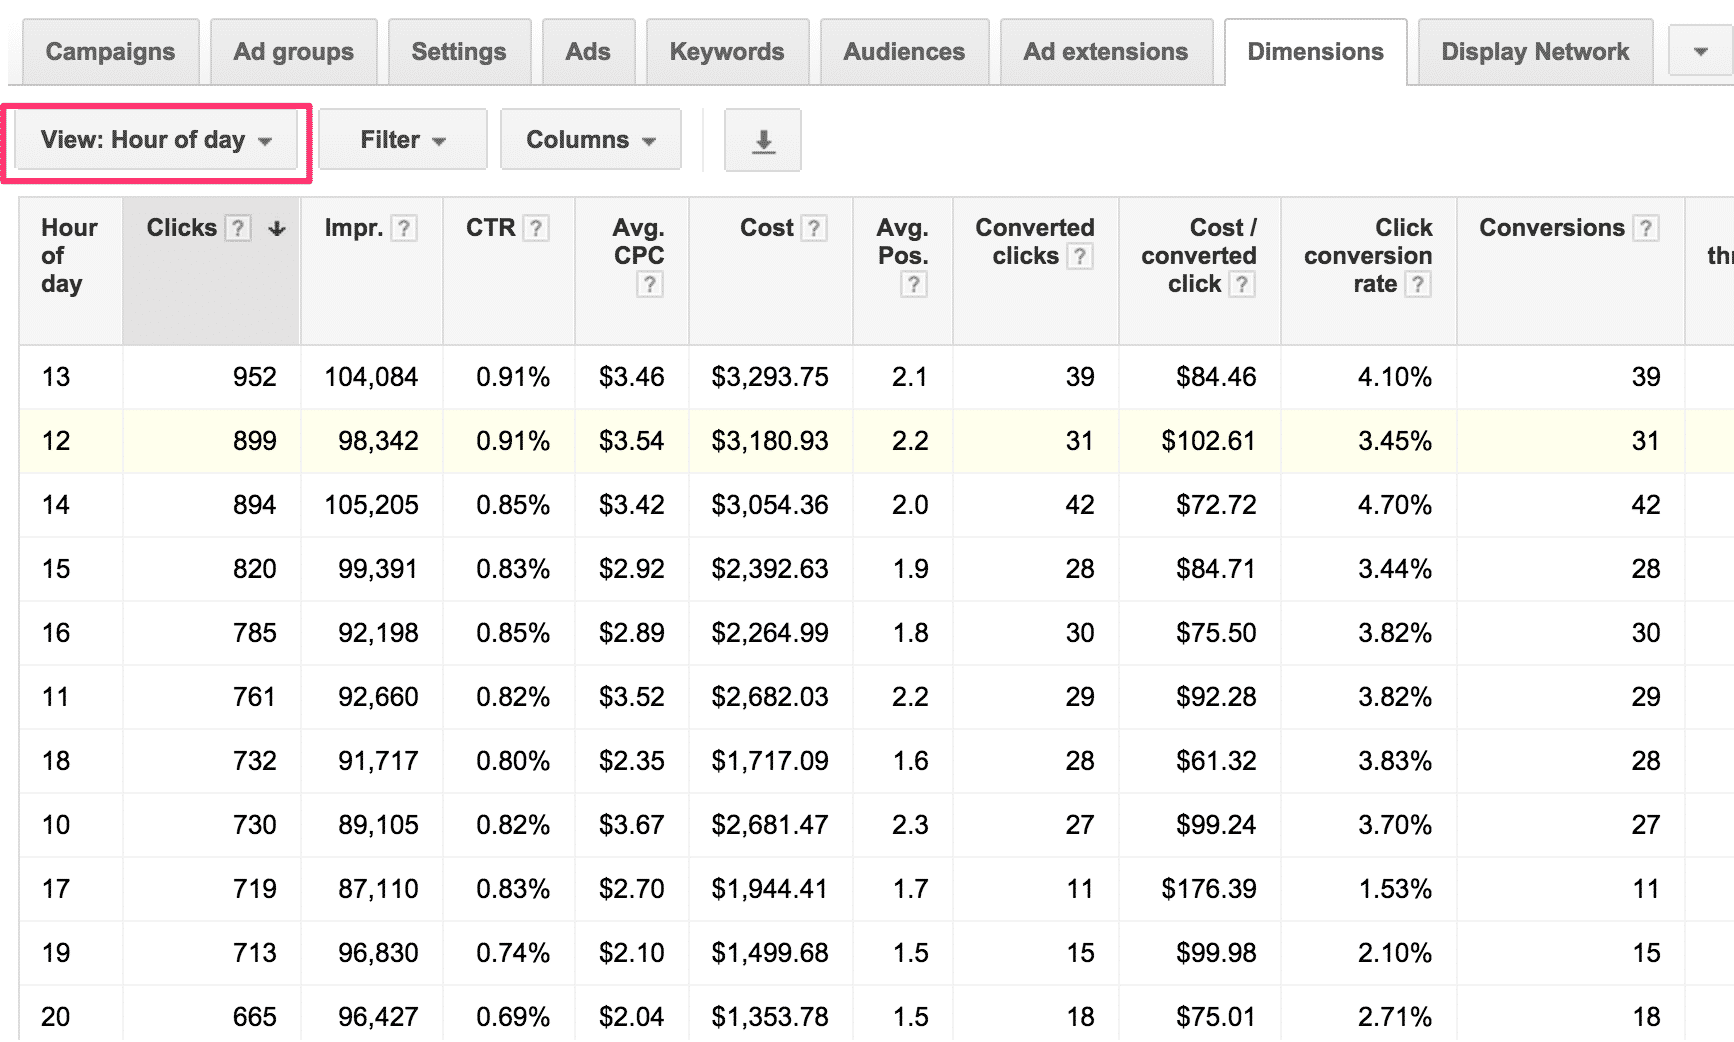
What hours are best for you to advertise?
[Tweet “Different hours have different #PPC results. Use the #AdWords Dimensions Tab to find out.”]
Destination:
The dimensions tab also allows you to take a look at the data from your ad’s destination urls! Depending on the landing page software you use, this can be a super useful tool for testing different landing pages and seeing how they are performing within AdWords to compare that data.
Whenever I am doing a brand new account review, or running specific landing page tests, I find this aspects of the dimensions tab extremely useful.
Use the AdWords dimensions tab and then go to View: Destination URL to find which places to send traffic perform the best.
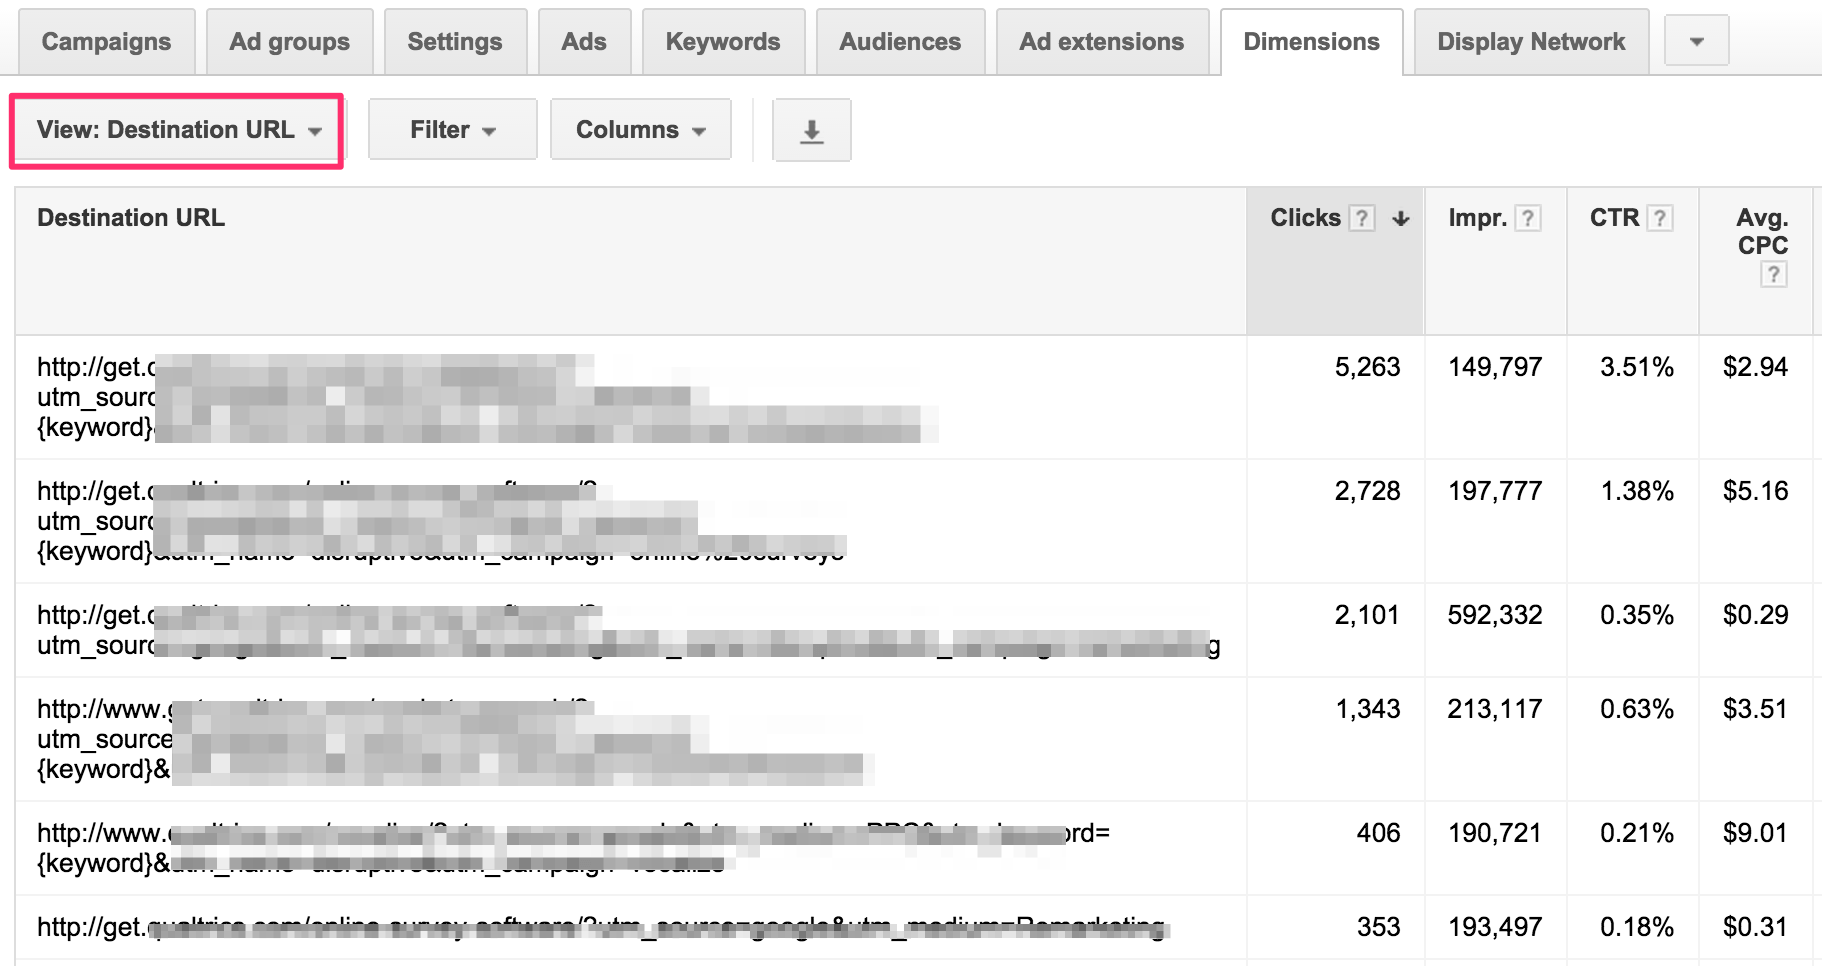
Think different pages perform differently? Look at this.
Geographic:
Breaking down your search data by location, obviously, is super valuable information to have as well. The AdWords dimensions tab is again a very useful area to take a look at how the account is doing within the areas you are targeting. It can even break it down by city, so on high traffic accounts, you can really spend a good amount of time taking a look at what countries or cities you should or shouldn’t be advertising in.
I use this view all the time specifically if I’m testing out a new area to target for a client and I want to see how that compares to the rest of the account.
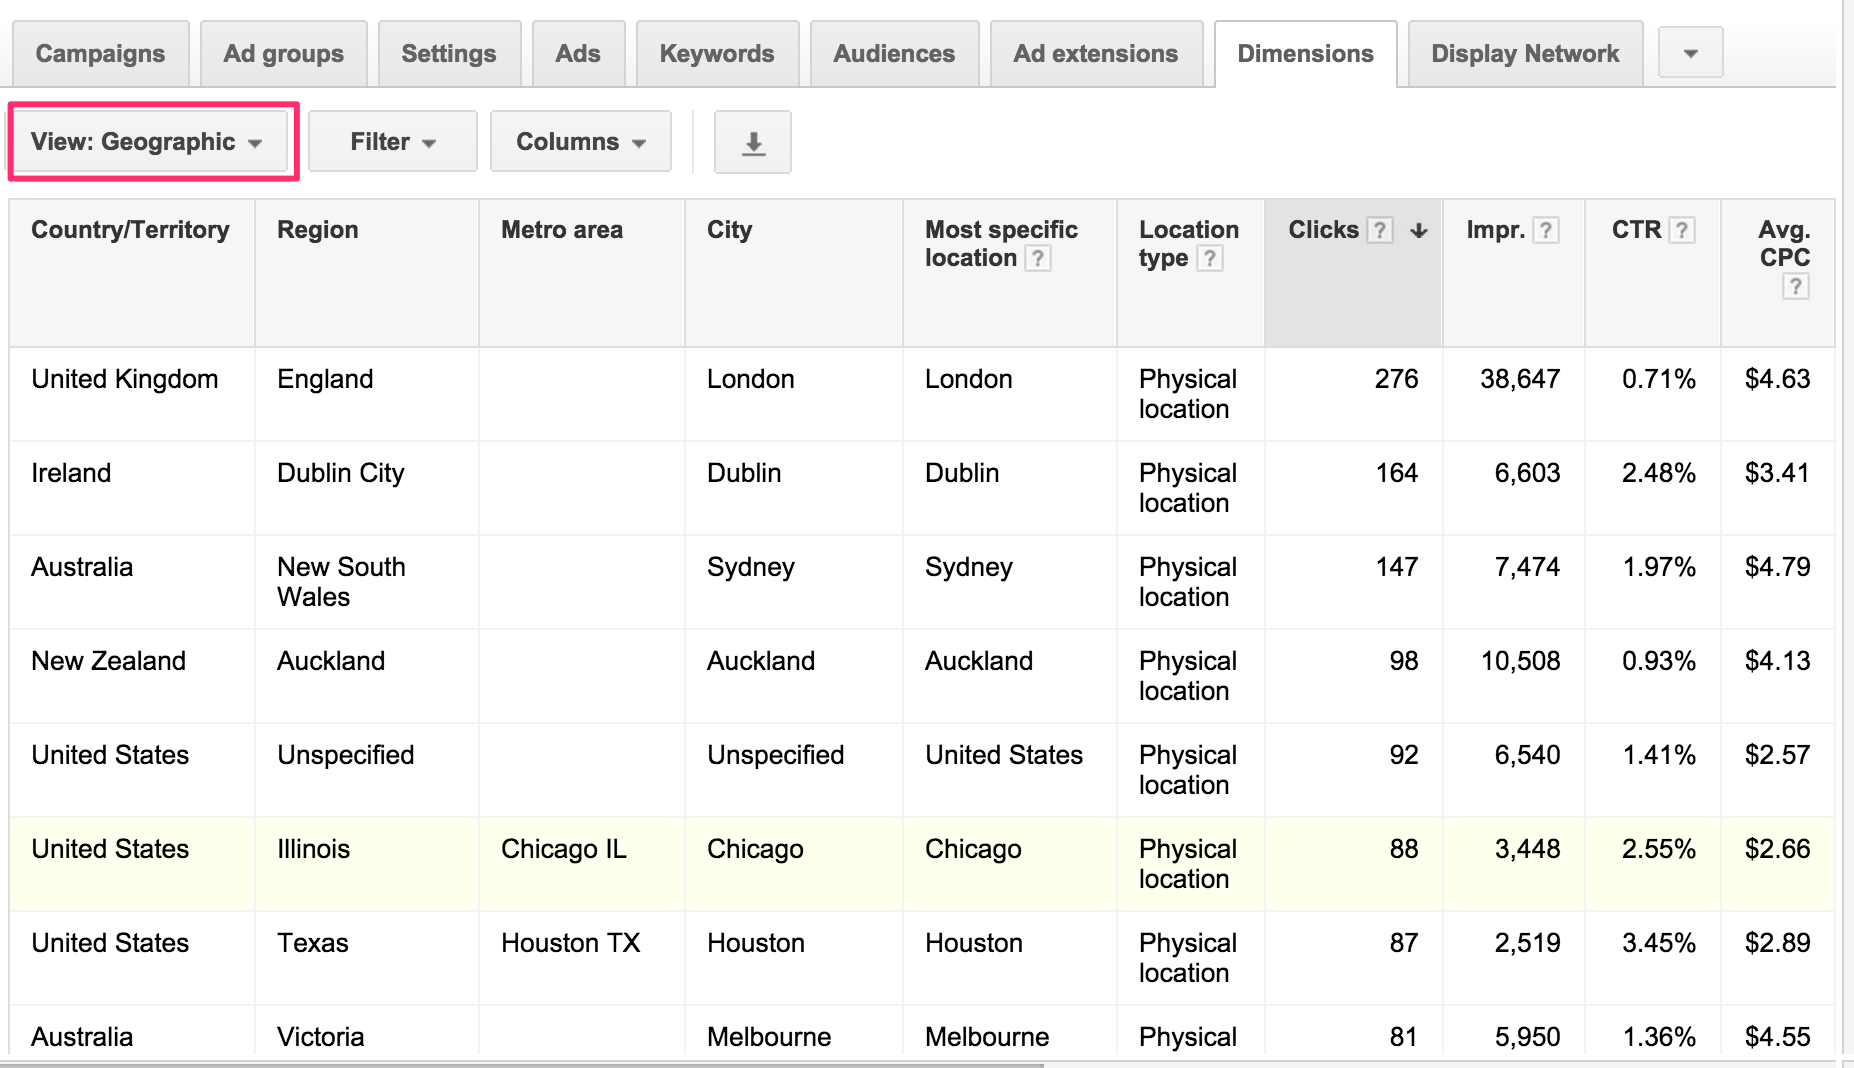
Which city or county has the best ROI for you?
[Tweet “Which state or city is performing best in your #AdWords account? Find out here”]
Top Movers:
I saved one of the best views for last. If you’ve noticed any spikes (for the better or worse) on a campaign or account, this is a fantastic little gem in the dimensions tab. The top movers view quickly breaks down the areas of your campaign that have increased, decreased etc. over a specific period of time.
This is fantastic if you want to find the culprit for a spike you weren’t exactly planning on or to show a client proof of some of the great headway you’ve been making on a particular campaign or Ad Group in the account.
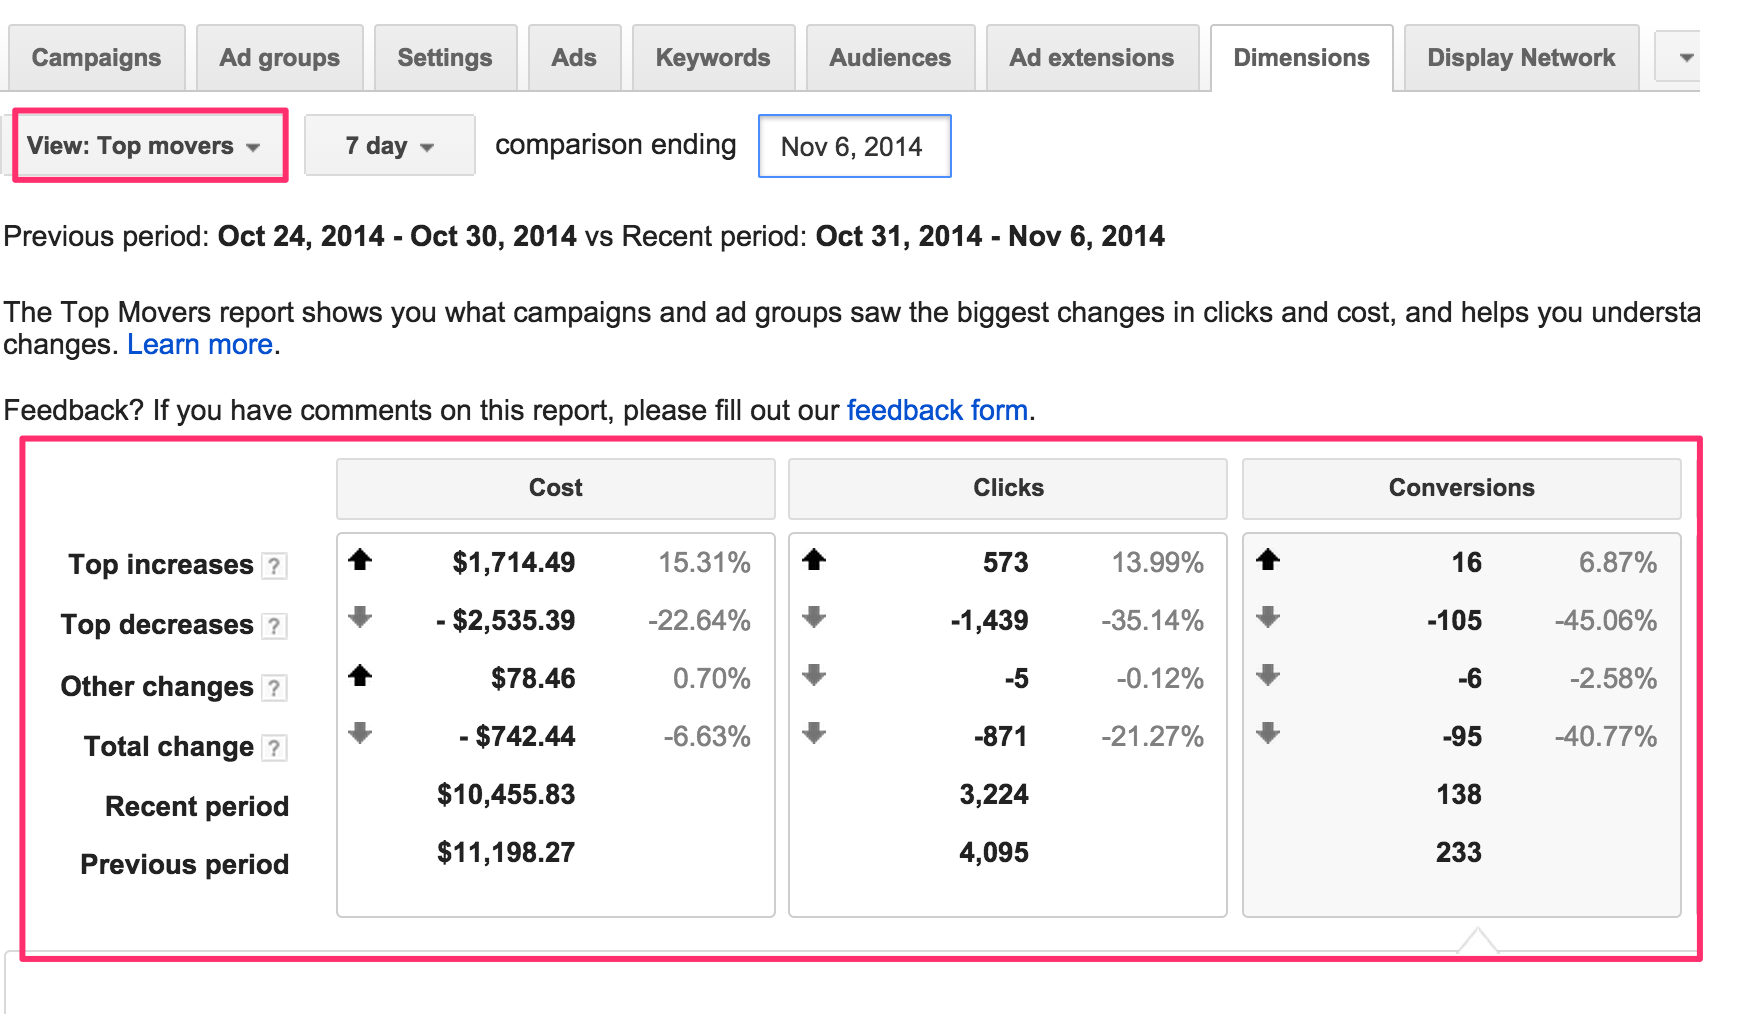
Something change in your performance? Look at this view.
As you scroll down from this view, it breaks up the top movers into the top increases and top decreases. The best part about this is you can even click the links to the right of each area to see the exact changes in the account that might be the cause for the increase or decrease. Here are a few screenshots of what I’m talking about:
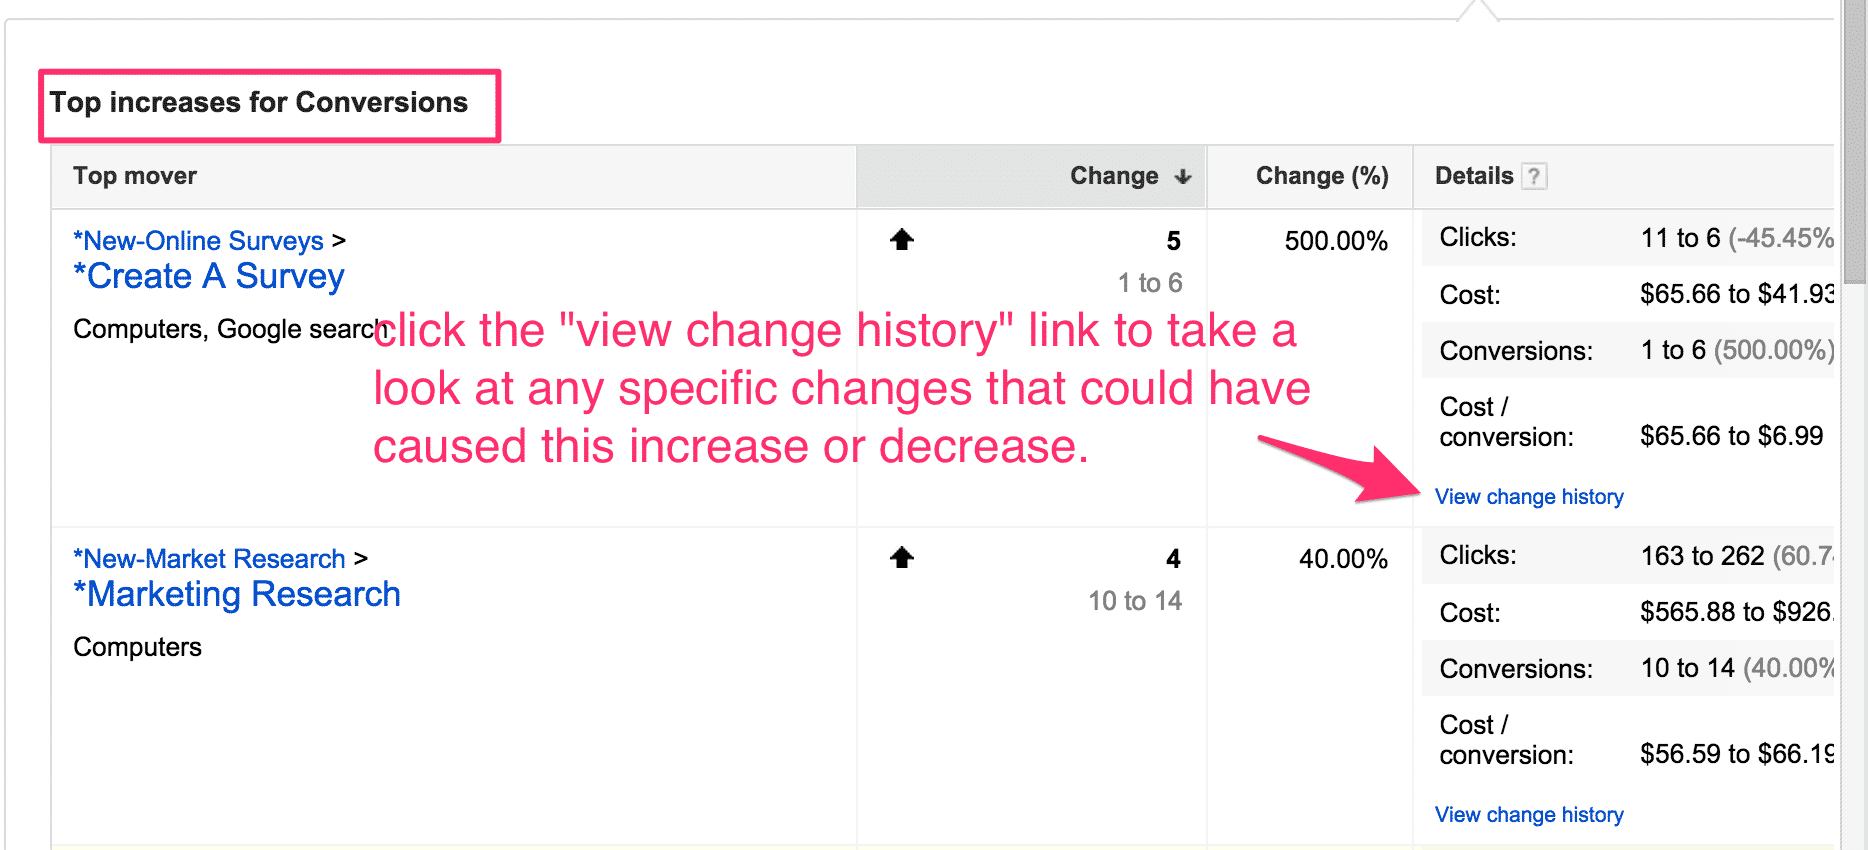
See exactly what changes were made to impact the performance.
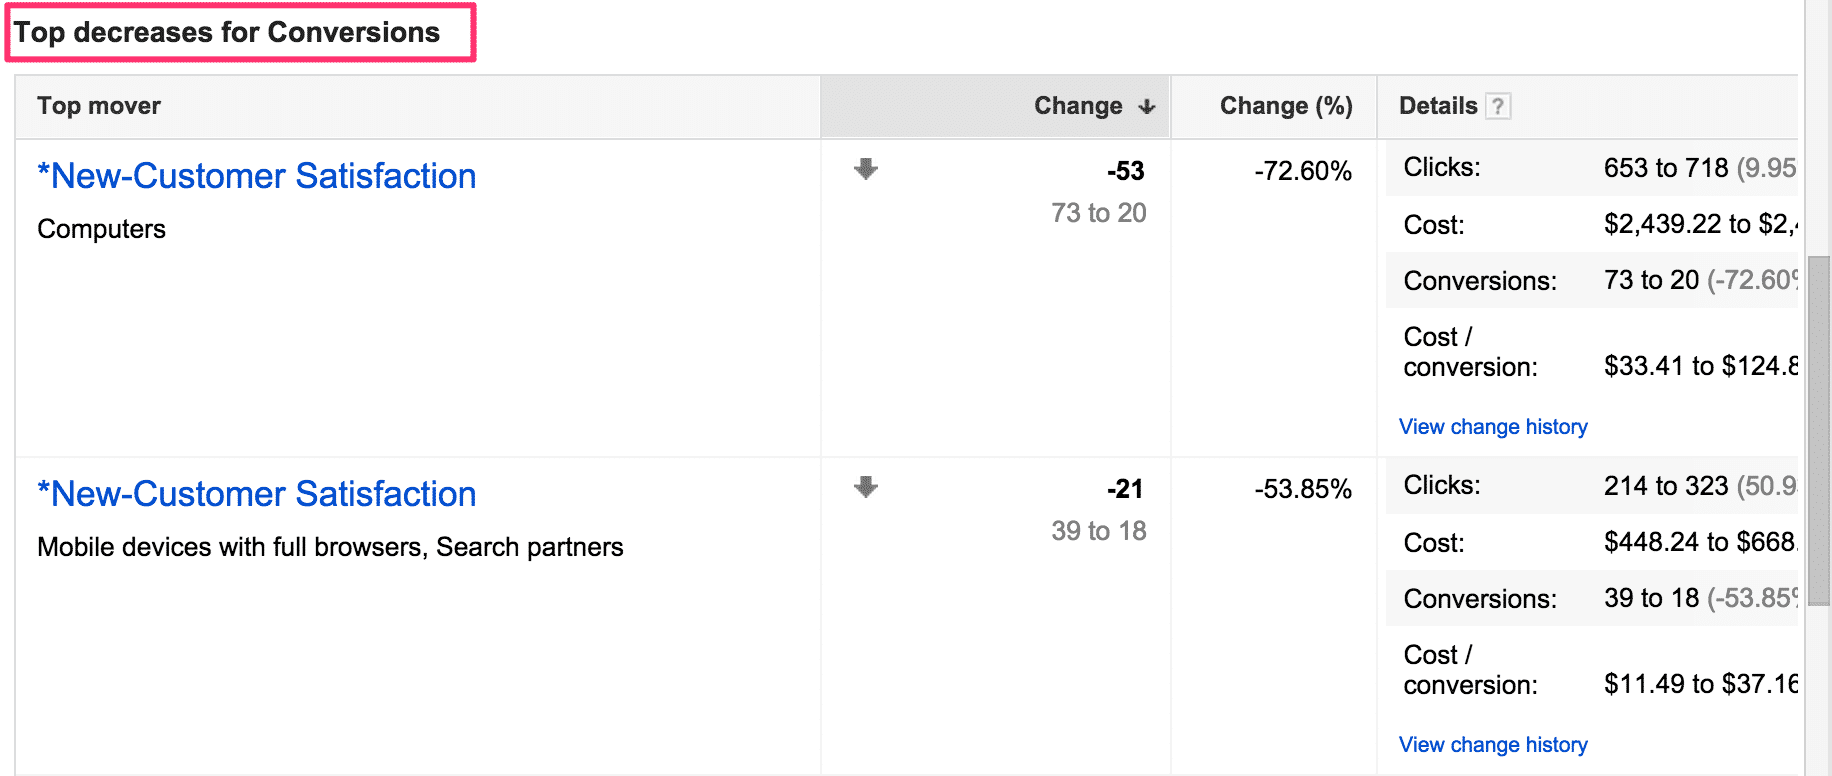
Did something decrease that was bad? Look what made the change.
The AdWords dimensions tab has much more than what I’ve covered here today so please take some time to use this tool that Google has to offer. Trust me, this is one tab that you can click around in without any fear of screwing anything up.
I hope this has given you a small look into an area of AdWords that can help you gain deeper insight into your account to make significant changes to either save money or help increase profits.
As marketers we are often asked to come up with a plan to keep things moving in the right direction for our clients or organizations, and the dimensions tab is a great way to supply the data driven ammunition you will need to make the best decisions or kick butt in an upcoming sales pitch.


