
GA4 vs Universal Analytics | The Biggest Differences
by Joseph Jones • February 3, 2023


Google Analytics: whether you love to hate it or hate to love it, you’ve at least come to know it. And just as you got to know it, you learn that Google Analytics 4 (GA4) is replacing Universal Analytics (UA).
Deep breaths… it’s all gonna be okay.
GA4 is similar enough to UA that you should be able to navigate it just fine and even enjoy some enhanced features. We will highlight the main differences between Universal Analytics and Google Analytics 4 along with the benefits of why you need to make the switch ASAP!

What Is GA4?
At a glance, GA4 is:
- Google’s newest iteration of data analytics
- Permanently replacing Universal Analytics
- Is event-based rather than session-based
- Tracks App data along with Website data instead of separately
- Has machine learning at its core
- Is privacy-centric by design
- Will officially replace UA on July 1st, 2023
GA4 vs Universal Analytics: The Main Differences
Google Analytics 4 tracks data in a slightly different way than Universal Analytics, primarily by using events instead of sessions as reporting units. The metrics you’re used to seeing in UA will now fire as events. The functionality you expect from Universal Analytics is still there, but drilling-down on specifics looks a little different.
EVENT VS SESSION-BASED MODEL
The difference between an event and a session-based model is that even sessions in GA4 are counted as events, as are conversions and other predefined goals (which are also called “conversions” in GA4!). Sessions themselves must meet certain criteria, like the “engaged user” criteria and are then counted as events.
WHAT IS AN ENGAGED USER?
Consider the “Engaged User” measurement change as a new way to see data. In fact, it is a shift from the “glass-half-empty” to a “glass-half-full” perspective. Engagement Rate is a new metric in GA4 and is replacing the ever-popular metric, Bounce Rate.
Ironically, Engagement Rate is almost the opposite of Bounce Rate.
Bounce Rate, you remember, measures the percentage of Sessions that ended with only one Page View. Engagement Rate, on the other hand, indicates the percentage of Sessions that resulted in an Event, Long Session, or Conversion (all good things!).
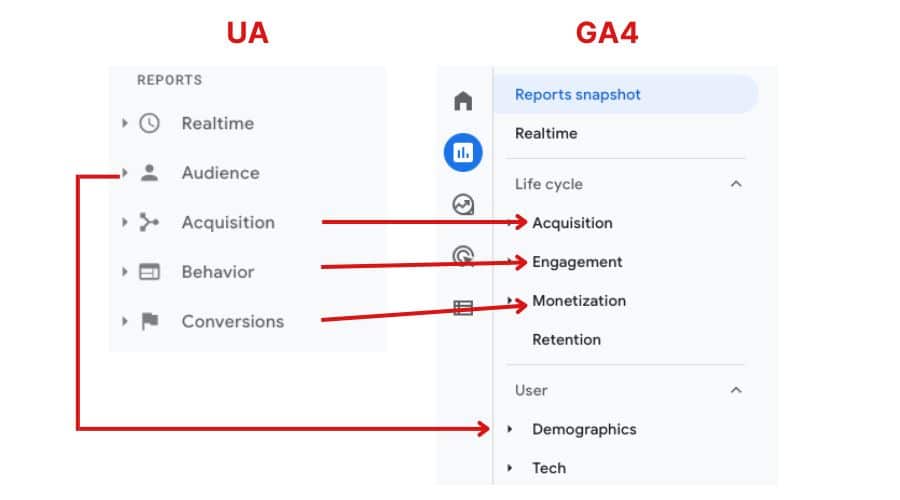
BEHAVIOR & MONETIZATION REPORTS
So, Engagement has replaced Behavior but reports many of the same things. Added to this are Conversions which were previously known as Goals.
GA4 also uses a metric called “Monetization” which takes all streams of revenue into account, like Google Ads, subscriptions, and your eCommerce platforms. This kind of customer-centric engagement more accurately reflects the lifecycle of purchases across devices and platforms so you can see where the most or most meaningful engagement occurs.

SIDE NOTE: In GA4 you now have the option to link to Google Merchant Center, BigQuery, and Google Optimize, natively and for free. Not too shabby!
CROSS-PLATFORM, CROSS-DEVICE DATA
Because GA4 uses all available identity spaces like User ID, Device ID and Google Signals, it can help to reduce duplicate reporting. For example, if a user is visiting your site and app or on multiple devices, it can look as though you are getting more traffic than you actually are (in terms of unique users).
This new cross-device, cross-platform data collection should ultimately result in more specific reporting too, providing valuable insights about how a consumer’s journey is progressing. It could be, for instance, that a visitor to your website makes their purchase from a mobile device after doing more research on your product. Knowing where your customers are most engaged can help you to improve those pages or app features and your sales funnel. Down the hatch!
Free copy of our Introduction to GA4 Guide.
There are a few small differences in the way Google will report on the metrics you are used to seeing. Check out this side by side comparison of some of the benchmarks you are used to getting reports on:
| Metrics | UA | GA4 |
|---|---|---|
| Users | Tracks total users and new users. | Tracks total, new and active users. *Active users is the new primary user metric for GA4 and will consist of “engaged users (see bounce rate metric).” |
| Page Views | Total number of pages viewed. | aka Views: Total number of app screens and/or web pages your users saw. (The Views metric found in the reporting interface is the combination of pageviews and screenviews.) Repeated views of a single screen or page are counted. |
| Purchases | Purchase events are fired within the Enhanced Ecommerce model. Data is pulled from a products array via Google Analytics-provided JavaScript and collected in a purchase event when you choose to send that event (from Google.com). | Purchase events are recommended and collect data in a similar fashion to UA, but there are differences. Does not provide additional JavaScript for array collection and expects you to provide the items array when collecting a purchase event on your own (though the same advice is given with regard to populating a data layer object). |
| Sessions | Time a user is actively engaged on your site. Timeouts & new sessions can occur. | To determine the session that each event comes from, the session_start event generates a session ID and Analytics associates the session ID with each subsequent event in the session. |
| Session/Traffic-based Acquisition Metrics | Found in the Acquisition section. Channel or Source/Medium is the dimension being analyzed against metrics such as Users and Sessions. | Traffic acquisition metrics can be found in the Traffic Acquisition report. The dimensions of Channel or Source/Medium are measured against metrics such as Users and Sessions. Note that the main differences you may see between UA and GA4 for acquisition metrics are aligned with the differences you will see for the metrics of Users or Sessions (Google.com). |
| Conversions | UA counts goals defined by you and only one conversion per session for each goal. So, if a user submits the form twice during the same session, only one conversion will be counted for the “Form Submit” goal. | GA4 counts every instance of your conversion event, even if the same conversion event is recorded multiple times during the same session. |
| Bounce Rate | Percentage of times that a user visits your site, reviews content on your landing page for several minutes, but leaves without clicking on any links or triggering any events. | Percentage of sessions that weren’t engaged sessions (An engaged session is defined as a session that lasts 10 seconds or longer, has 1 or more conversion events, or has 2 or more page or screen views). |
GA4 VS UNIVERSAL ANALYTICS PRIVACY AND FILTERS
Remember that GA4 combines web and app data in the same reporting property so when you are looking at these metrics, be sure to consider which source the data is coming from. These can be set up as data streams within the same property.
GA4 doesn’t support filters the way that UA did, i.e. UA and GA4 can filter out internal IP traffic, developer traffic, and unwanted referrals, but UA can use additional filters that, for privacy purposes, GA4 cannot.
Key Tip: Be sure to have the same filters in place when comparing data from your website and your mobile app.
With GA4, IP addresses are neither logged nor stored, making it more privacy-friendly for users. In comparison, UA always stores IP addresses and only offers an optional IP anonymization protocol.Savvy internet users adjust their privacy settings and “cookie consent” for their information to be collected (or not……the nerve!). GA4 offers Google Consent Mode which is a privacy feature that allows modifying the behavior of Google tags on your website based on those user consent preferences.
Other differences between UA and GA4 include the basic layout and how it’s now easily navigable. For instance, items that used to appear in the main left-side menu are now visible once you click on “Reports” specifically. There, you will see a variety of predefined reports, many of which you are familiar with.
Just one extra click and you will be in the cozy, familiar pie-charted wonderland you’re used to! You can, of course, still customize reports to track the specific data you are most interested in.
When Will Universal Analytics Be Disabled?
GA4 was officially launched in 2020 as an optional property to install in your site, however, it will effectively replace Universal Analytics on July 1, 2023. Google reports that there will be access to historical data via your UA account for 6 months, but after that, even that data will not be accessible.
Side Note: 360 Universal Analytics properties will receive a one-time processing extension ending on July 1, 2024.
The sooner you transition to GA4, the better, as it will not be collecting or converting that historical data from UA. Exporting your historical data is, therefore, highly advisable!
What You Should Do Now
Be sure that you install GA4 and enable reporting ASAP. Installing the property will be much the same as installing the UA code. Many of the predefined reports it provides will be very familiar. If you’re nervous about switching from UA to GA4, be assured that you will have the same and even better data reporting and measurement abilities with this new platform.
Click here for a UA to GA4 migration checklist.
How We Can Help You Use GA4
Data collection and interpretation is complicated, and even unfun (for some). Knowing how to break down the most important metrics and information can mean the difference between succeeding or failing in business. Having an agency who can help with this could be vital for your company.

We’ve implemented GA4 across many client websites with accurate tracking events. Our team is also complete with GA4 Certified marketers who can make your life easier in deciphering the new data you’re gathering from GA4 and compare it to Universal Analytics.
If you want to get more out of your data and use it to drive sales and success, contact us today. We’ll put GA4 to work for your company!


