
Introducing the Adobe DTM Debugger
by Adam Haining


At Disruptive Advertising, we love Adobe DTM. It truly is (in my opinion) the best tag manager for marketing analytics out there. I’ve used pretty much everything out there and, when I’m in another tool, I keep wishing it was using Adobe DTM.
As great as DTM is, it is impossible to know what’s actually firing without using developer tools (Chrome Developer Tools, Firebug, Firefox Inspector, etc). I knew there could be a better way to easily debug and see what is going on with Adobe DTM on any page, so I finally built a neat little tool to help.
Meet the Adobe DTM Debugger! Before we get into the details, let’s get it installed! If you’ve ever used the Adobe DigitalPulse Debugger, using this is very similar. Create a new bookmark in your favorite browser, and set the location of that bookmark to the following code:
javascript:void(window.open("","disruptive_dtm_debugger","width="+screen.width+",height="+screen.height+",location=0,menubar=0,status=1,toolbar=0,resizable=1,scrollbars=1").document.write("<script id=\"disruptive_dtm_debugger\" src=\"https://static.disruptive.co/disruptive/dtm_launch_debugger.js\"></"+"script>"));Did you see what I did there? I host the tool in Adobe DTM that helps you debug DTM!
Now, on to the features:
Settings
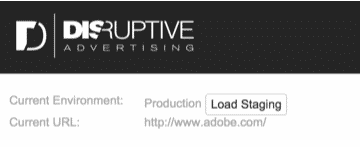
At the very top of the rule are some basic settings. You’ll see the following:
Pretty simple. Shows you which DTM environment is loaded (production or staging), and it will give you a button to click that will reload the page and load the new environment. BUT WAIT, THERE’S MORE!
One thing that can be confusing is if you are in a development environment that has the staging library already loaded on the page. You cannot have the production library loaded over the staging library; so, to avoid any confusion, you will not see an option to load the production library.
Rules
The previous method for knowing if a rule fired on your page was to turn on the DTM debug mode and then scour the console in your browser. If that sentence didn’t even make sense, don’t worry about it, just know it was fairly difficult to see what was happening on the page.
Now, when you open the DTM debugger, you’ll see a list of ALL of your rules, if the rule is on the current page, whether or not the rule has fired and what kind of rule it is.
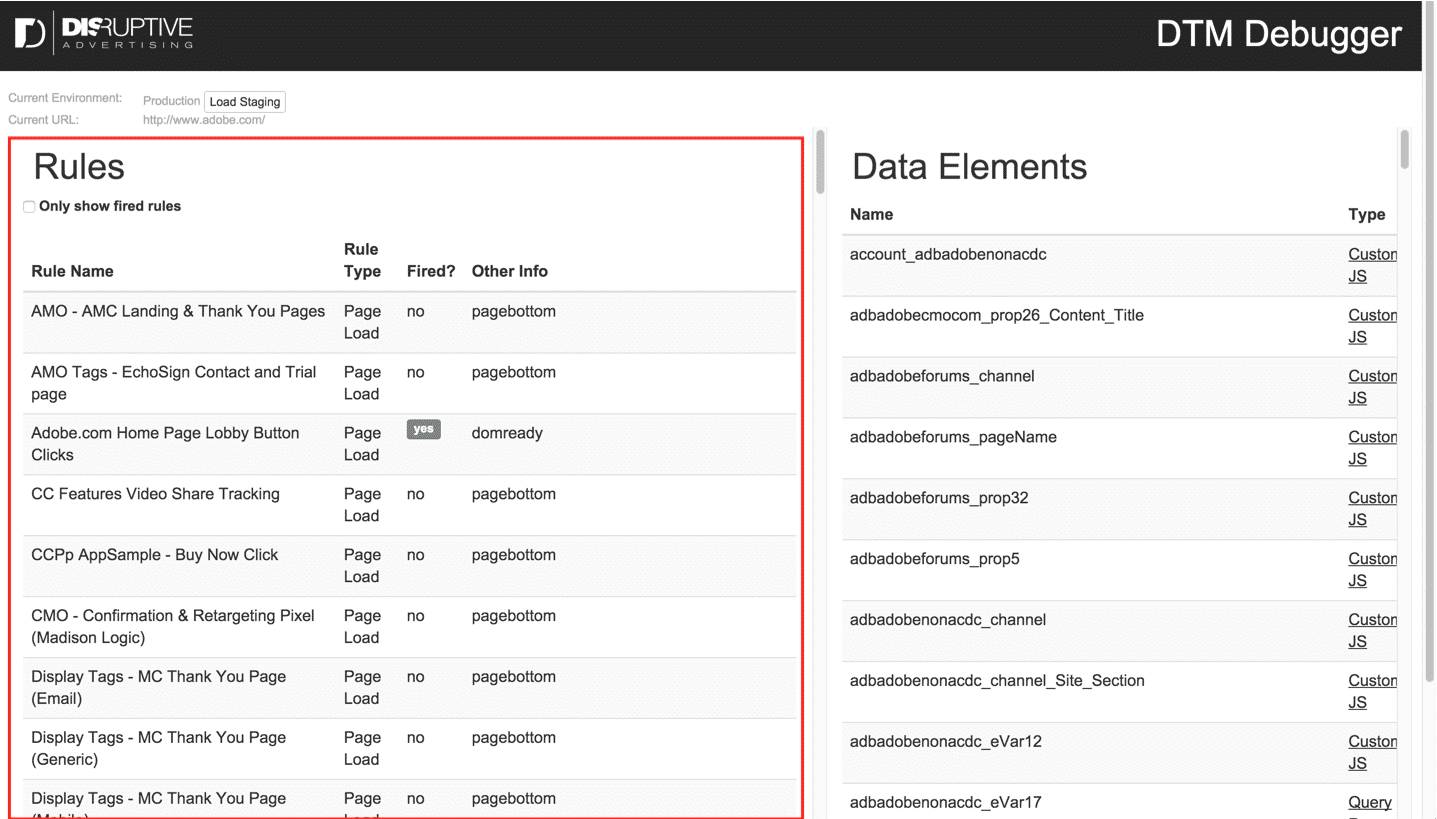
Not only does it show when a rule has fired or not; but, if that rule fires after the initial page load, such as an event-based rule or direct-call rule, the rule will highlight when it fires and show the little green tag that it has fired.
Seeing all of your rules can be overwhelming and involve a lot of scrolling, so we’ve also included a nice feature to only show the rules that have fired. Just check that box and your rules will automatically be filtered. New rules that fire after the initial page load will even appear once they have fired.

That’s it for now, but there are some plans to expand what this does, including:
- List the various conditions and their details.
- List the tools that are configured for the rule, and what the settings are.
- List the 3rd party tags; and, if possible, link or show the code for each of the tags for easy access.
Data Elements
If you’ve used DTM in the past, you had to use the console of a browser to check the value of a data element. This involved:
- Using use _satellite.getVar in the console
- Knowing the exact name of the data element, including if something was uppercase or lowercase
Seems fairly easy, but it was quite the chore. This tool will automatically show you a list of all of your data elements, as well as the current value of that data element!
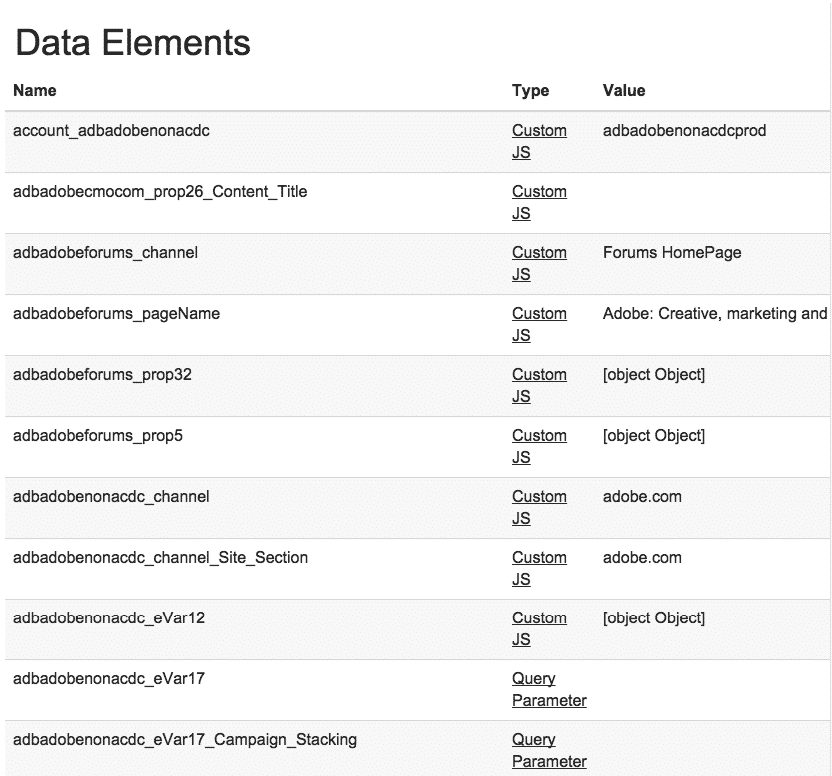
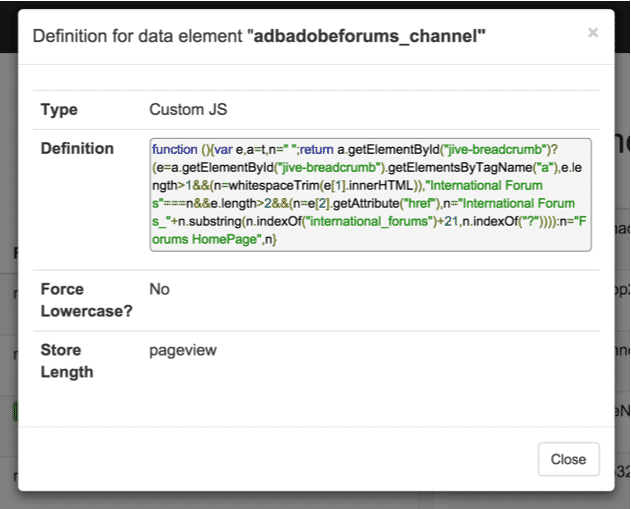
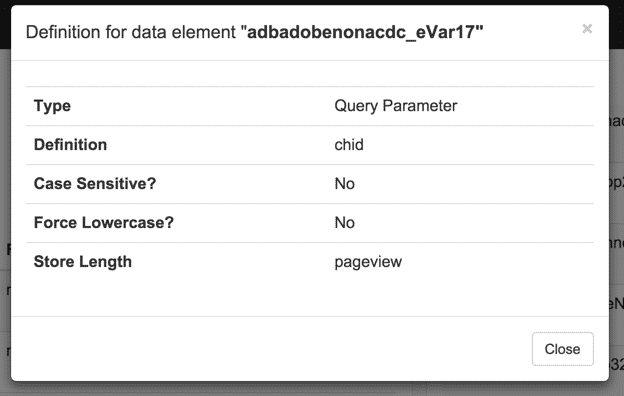
You can even click on the underlined “type” of the data element, and it will show you the definition of the data element.
As great as showing the data element value automatically is, we plan to have it be optional where you can click to get the value, as there may be some implementations that have the data element do more than just return a value.
DTM Notifications
Previously, the way to debug DTM was to turn on the debug mode and look in the console of your browser. Now, DTM automatically puts information into the debugger when tools load, rules fire, and on a many other events.
You can also use the _satellite.notify function to put your own content into the debugger. Here is what your typical view of the debug messages and notifications looks like:
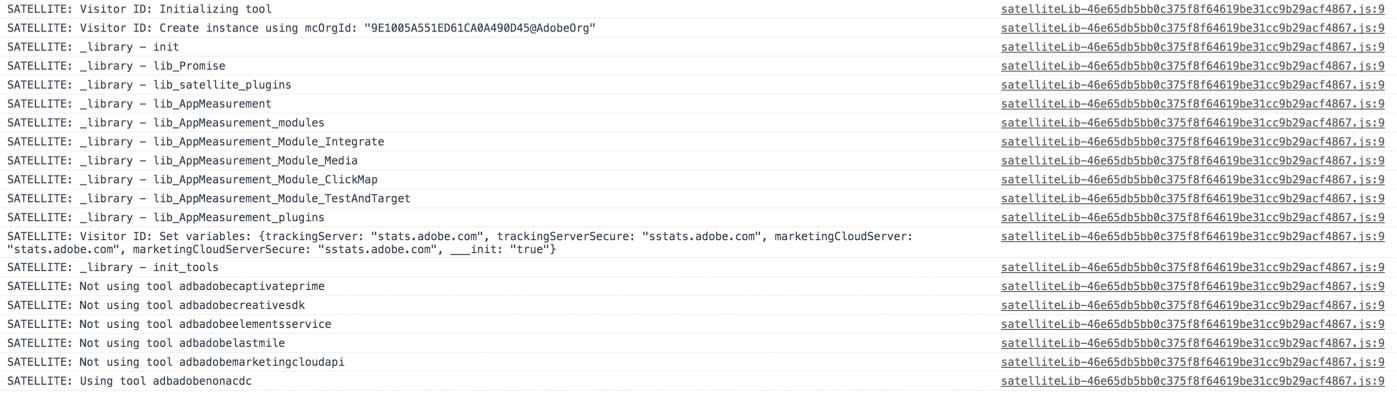
Since I am running my examples from adobe.com, there is A LOT of information here, so this is just a preview.
In the DTM debugger, you can view this same list without having to open the console and you exclude the prefixed “SATELLITE: ” on the messages as well as any non-DTM messages printed to the console.
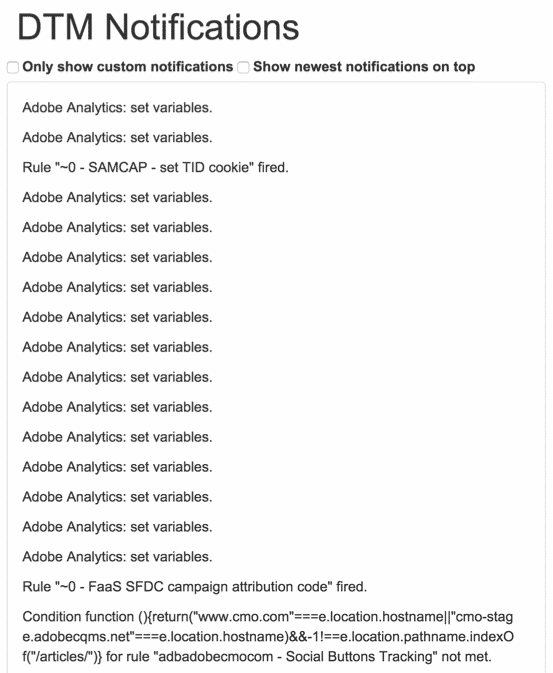
BUT WAIT, THERE’S MORE! This list will automatically update as new items are printed to the page, and it has 2 really handy checkboxes.
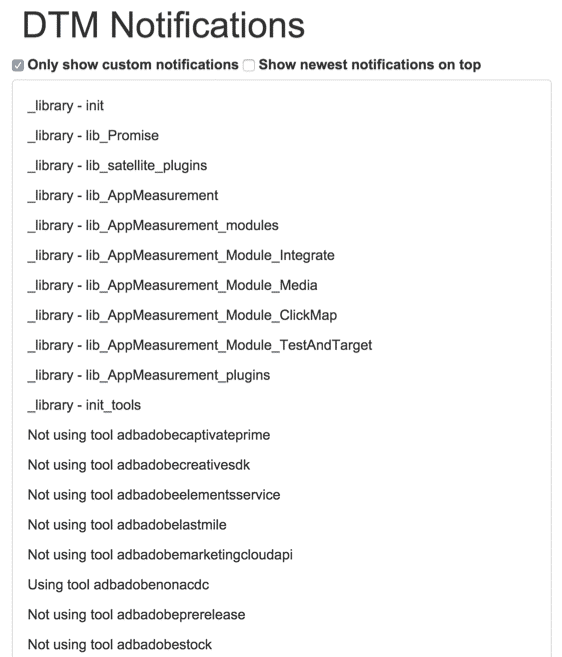
1. Only show custom notifications
If you use _satellite.notify in your code, and your messages don’t match any of the default DTM messages, they will be the only ones to show up.
This is really handy for looking at what you purposefully coded without wading through a lot of notifications. Look at the difference between the above screenshot and what it looks like after filtering for custom notifications.
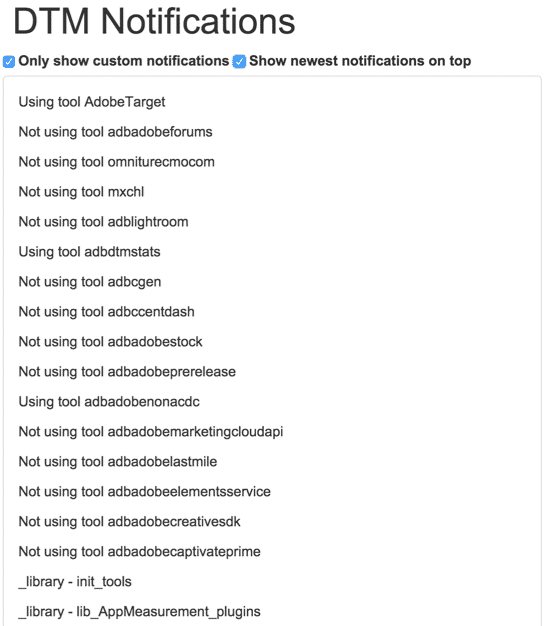
2. Show newest notifications on top
By checking this box, you don’t have to scroll to the very bottom to see what’s new on the page, it will list the newest notifications on top. Makes this really easy to debug!
Configuration
The last feature of the DTM debugger is the configuration. It shows the environment that is loaded (yes, it shows it up top, too). It currently only shows the environment and the installed tool. In the case of adobe.com, there are a lot of analytics tools installed.
The plans for this are to be able to click on a tool and view the configuration / settings of the tool.
DTM Not Installed?
This might be my favorite part. At the 2015 Adobe Summit, the DTM team wore these shirts that are a play on the Run DMC logo that say “RUN DTM”. They are genious. As a tribute to this shirt (which I still do not have), if you open the DTM debugger on a site that doesn’t have DTM installed, it will show this:
Contribute! (Your time and ideas, not money)
As great as this tool is, there may be a few bugs that pop up, as well as better features that will make it even more awesome. Please, please please send any bugs or recommendations our way! There is a link at the very bottom of the DTM debugger that will auto-draft an email, but you can also submit a comment on this post.


