
Ecommerce Metrics: Ingredients for Business Success
by Cydney Hatch • May 2, 2018


You probably know someone who bakes a lot and it seems like he/she just tosses ingredients into bowls and voila! Out comes culinary perfection. But, in reality, measuring is everything!
Proper measuring is critical to baking success!
Baking is a science and, when you mix together ingredients, you’re creating edible chemistry, so being precise is important. (I know I have learned this the hard way watching the Great British Baking show…Mary Berry and Paul Hollywood make it look so easy but they are so precise!)
Just like baking, ecommerce metrics require planning and precision!
Whether you are new to ecommerce marketing or not, there are specific metrics you need to carefully watch to ensure success. If not, you could be easily throwing money away!
In this article, we will highlight ecommerce metric “ingredients” you need to measure carefully for business success! When you do, your business will definitely “rise” to the occasion and bring in some serious dough! (Yes, that was a bread pun…)
Ecommerce Metrics: Ingredients for Success
Selling online without keeping track of your ecommerce metrics is like throwing in random amounts of ingredients and hoping your cookies turn out…it doesn’t work!
No business can survive if you don’t track what’s working and what isn’t! Just like a baking treat needs a recipe, your ecommerce business needs a plan!

One of the first steps in “baking” ecommerce success is setting measurable goals or key performance indicators (KPIs). You will then need to identify the appropriate ecommerce metrics necessary to track those KPIS as well as monitoring those KPIs over time so you can make proper adjustments.
These initial plans—along with the new ones that will inevitably develop over time—will help you discover the ecommerce metrics that make the most sense for your business and its specific goals.
Let’s take this a step further and talk about some of the specific metrics you should plan and look out for!
Conversion Rate
Your conversion rate is probably one of the most straight-forward metrics you’ll encounter. It’s simply the percentage of the website visitors who buy something from you!
This ecommerce metric is calculated by taking the total number of website visitors who buy something and dividing that number by the total number of people who visit your site and then multiplying that number by 100.
So, if you have 10 of the 200 people who visited your site bought something, your conversion rate would be:
10/ 200 X 100= 5% Conversion Rate
The next question you might have is, “what is a good conversion rate?” The answer depends on the industry, who you are trying to convert, what you are counting as a conversion and what it took to get those conversions.
In any case, even if your conversion rate isn’t great right now, as long as it improves over time, you’re headed in the right direction.

We all need to start somewhere. By tracking this number, you can increase your conversion rate and truly “take the cake!”
But how can do track your ecommerce conversion rate? The best way to do this is to set up a Google Analytics goal. Here’s how you can do it:
- Sign up for a Google Analytics account (if you don’t have one yet). Don’t worry, it’s FREE, and who doesn’t like free stuff when trying to build a successful business?
- Add the Google Analytics tracking code in the head section (aka <head>) of all the pages of your website. It will look similar to the example below:

- Integrate your shopping cart with Google Analytics. Not sure how? Here are the guides on how to do so for Shopify, BigCommerce and WooCommerce.
- Add the ecommerce tracking code on the order confirmation page of your products (this is usually your Thank You page).
- Enable ecommerce reporting in your Google Analytics view! Boom, you are done!
A few ways you can customize and specify your conversion rates include:
Conversion by traffic source (Google, Bing, Facebook, Reddit, etc). This will help you see where traffic is coming from and what channels you should focus your time, money and efforts on.
Conversion by device type (Mobile, Desktops, Tablets). This will show you opportunities to improve your advertising and content based off of the devices people are using! According to Yotpo, mobile accounts for more than half of all ecommerce traffic, so all ecommerce sites need to be mobile friendly—if yours isn’t, you’re probably losing customers!
Analytics Tracking
Leaving the success of your advertising up to chance is a good way to waste a lot of money.
Ecommerce business owners should track how their websites and ads are performing and where their traffic is coming from. This is why analytics is an important part of advertising strategy.
Using ecommerce analytics, you can examine your audience demographics, impressions, click through rates, cost per conversion and many other trends over a set of time. You can use this information to target potential customers by mostly anything these days: language, relationship status, likes and interests, employment or even income!
It’s all pretty cool!
Google tracks a lot of things and they can be mixed together in numerous ways. Don’t get overwhelmed, though. If you’re just starting out, the basic overview reports contain plenty of great information and insights to get started!
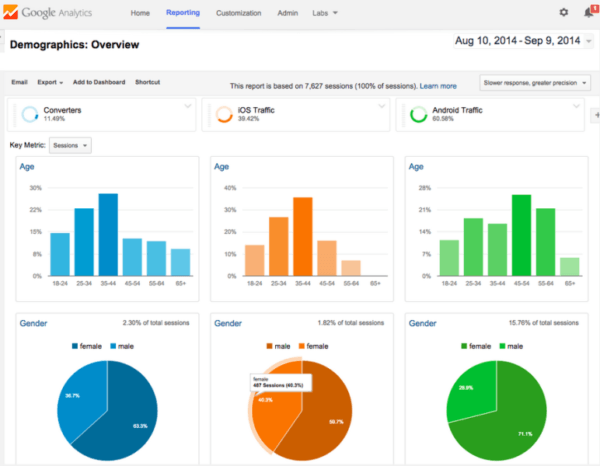
Report categories in Google Analytics are broken down on the left side menu. The most important sections you should get familiar with are:
- Real-Time – Shows you what’s happening on your site right now!
- Audience – Tells you more about your visitors.
- Acquisition – Tells you how your visitors got to your site.
- Conversions – Tells you more about your sales.

Using these insights, analytics and responses allows you to work smarter, not harder. This information helps you tweak business strategies to be better.
If something isn’t working, you can change it. If something is working, you can figure out how to continue advancing and promoting that idea—with more money and resources.
Customers: New and Returning
I think it’s safe to say that returning customers are far more profitable than new ones. But, people have to be happy with your product and service to come back.
If they completed an order once, your sales funnel worked with them, but you’re not done with the sale…you never are! Your job is to keep customers coming again and again!
There are lots of ways you can segment your site visitors, but one of the most important ways is segmenting them into new visitors and returning visitors.
 How is this helpful? By segmenting your traffic this way, you can answer the following questions:
- How visitors are new and how many returning?
- Do I sell efficiently to returning visitors? If not, how can I change that?
- Do returning visitors bring me more or less money than new visitors?

If you have a store where returning visitors bring you much more money than your new visitors, it might be worthwhile for you to invest a lot in getting a new customer. You also need to make sure there is a good customer retention strategy in place!
Customer Lifetime Value
Customer lifetime value (CLV) measures the estimated net profit of an individual over the entire span of a purchasing relationship. It can also measure the time a customer. It’s calculated by subtracting your acquisition cost from the revenue you received.
It’s hard to predict CLV but—once you get quality customers buying from you—you should be able to approximate the CLV of a new customer.
Loyalty and regular orders don’t always mean higher revenue or value—many people shop only at a discount. If that’s the case for your business, you should focus your retention efforts on the customers who tend to spend more.
Average Order Value
Average order value shows you how interested a customer is in your products. The more they are willing to spend, the happier they are with your products!

We all want to be that store that gets orders for $500 at a time! To help with your average order value you can offer:
- Promoted bundles and “2 for 1” sales
- Ad ons
- Loyalty programs
- Mix & match offers
- Discounted for seasonal items for a specific amount of time
Average Acquisition Cost
How much would you sell your soul for? Ha, just kidding…but average acquisition cost is a lot like that question.
This ecommerce metric measures how much it costs to get a new customer. The key to improving your average acquisition cost is to make sure that your ad spend is driving high-quality traffic.
There is a delicate balance between conversions and traffic. You need traffic to get sales, but you also have to pay for that traffic.
Analyze all of your traffic channels, including social media, online ads, online directories as well as referral websites to see which ones really make your business roll in the dough…

If you are putting your money in the wrong places, it can cost you! Also, make sure you plan what your maximum costs will be per person because in the long run, you might be losing money trying to just win new people.
Average Margin
This ecommerce metric is what is left over for you to “take home” after taking out what your costs were. Simply put, it’s what portion of the retail price is your profit!
That’s what you work for.

You may be selling tons, but if you aren’t making any profit, you might as well quit the business! Business is just as much about making money for YOU as much as it is about helping the customers.
If you want your business to be sustainable, you need to keep your average margin higher than your average acquisition cost (a lot higher, hopefully). Make sure you think about your profit margin and how you will get a cut out of the business profits!
Cart Abandonment
On average, 54% of people abandon their shopping cart due to shipping costs…woof! That’s not good news for ecommerce businesses!

Since most people do not like hidden costs associated with a purchase, seeing the prices go up after a shopping experience might hurt their chances of actually clicking “confirm and buy!” The first step in reducing abandonment rate is getting rid of hidden costs!
Since shipping costs are probably the biggest jump in price people hate, but you can’t necessarily eliminate shipping costs. Instead, consider looking at the following deterrents:
- Registrations without the option of guest checkout
- Checkout experiences are not user-friendly
- No free shipping options
- Delivery times are not clear or too long
- No options for alternative payment methods like Paypal, Applepay etc.
All of these will affect your customer experience, so make sure your purchasing experience is easy, fast and “with the times.”
Return & Refund Rate
This ecommerce metric is calculated as the percentage of product returns compared to total sales.
Returns and refunds are the “let downs” of your business. It’s not just a lot down about the money returned…it also means there is an unhappy customer.
Now, before you get a bad taste in your mouth, here is hope!

Although none of us like to lose money we have “already earned,” this metric can really be helpful as it might teach us how we can make the products and services better.
How? Well, high return rate shows us problems with product quality or customer satisfaction. This is something you can improve and change!
Segmenting your return rate by products will help you remove underperforming products from your site. By doing so, you decrease the chances of returns and refunds and increase the number of happy customers!
Unhappy customers hurt your business with bad reviews. Bad reviews, negative word of mouth and other PR headaches are not something you want to deal with.
So, how do you avoid creating returns and unhappy customers?
First, be transparent, visual and clear about the products you are selling:
- Use high-quality photos and videos of products (perspective, in use and comparisons for sizing etc)
- Create helpful descriptions and content for products
- Share measurements of models or products used in the photos for scale
Second, put your money where your mouth is! I think we have all fallen prey to the “China buys” of getting products of less quality or size than we bought. There’s nothing more frustrating than receiving a product of worse quality than you paid for.
Sometimes it’s so bad…it’s funny!

Don’t be that ecommerce company that isn’t transparent about the quality of their products! People buy because they trust you, so honor that purchase because you can quickly make enemies!
Third, be a good customer services ecommerce business!
When customers are not happy, follow up with them and work with them! Fewer returns means money that stays in your pockets, more happy customers and a strong brand image! What a great thing!
Voila! Successful Ecommerce Metrics!
Throughout this article, we’ve discussed a lot of key ecommerce metrics. By breaking down each metric by location, device used, campaign, and product, you’ve got a recipe for success!
This information will be the “secret sauce” to running a successful data-driven ecommerce business!

Like measuring ingredients, tracking business data leads to sweet end results. Enjoy the hard work, a successful business is truly a treat!
What metrics do you track in your ecommerce campaigns? What tools do you find the most helpful in adjusting and tracking them? Share and comment below!
Also, if you would like some help setting up KPI’s, ecommerce marketing plans or business analytics, let me know here or in the comments. I would be happy to help!


