Core Web Vitals: A Full Guide to Optimizing
by Joseph Jones • February 17, 2023
Well, well, well, Google’s done it again but this time, we’re all for it. A couple of years ago (2020), Google announced a new system of metrics that aimed to focus on user experience when it comes to web page interaction. These metrics are referred to as Core Web Vitals.
Basically, Core Web Vitals (CWV) are metrics that take into account page performance and experience and have a direct impact on SEO rankings. If your website is fast, doesn’t break, elements don’t move around inappropriately upon render, and SEO best practices are followed, then you’ll likely have a higher CWV score.
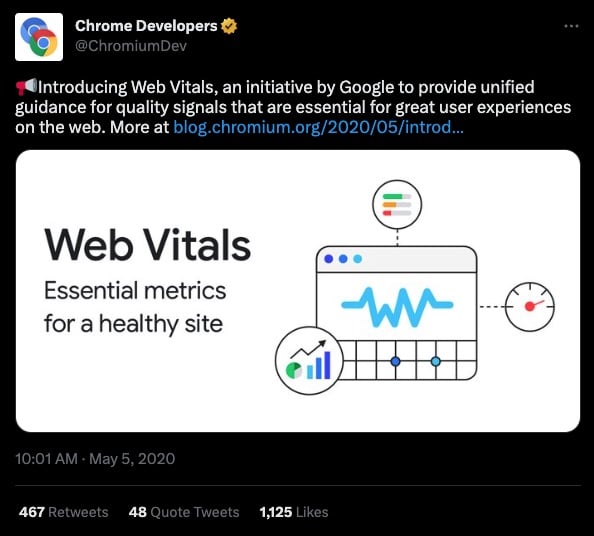
Since this update does have a direct impact on your SEO results, CWV are very important metrics to keep an eye on to see how they impact your SEO.
What Are Google Core Web Vitals?
Before a doctor makes a diagnosis or even dives into your symptoms, your vital signs are taken.
Similarly, the Core Web Vitals Google measures are the very basic metrics that need to be working well before other metrics are tackled. Once the core vitals are in tip top shape, you can dive into other Page Experience Web Vitals.
Bear in mind that Core Web Vitals are not all of the user experience metrics and don’t paint a comprehensive picture of your website’s UX. They are, however, so central to the overall performance of your site that they are included in all of Google’s popular tools. These Core Web Vitals come from field data, meaning they use actual and not simulated data.
Core Web Vitals: The CrUX of the Matter
You’ve heard that Core Web Vitals, or CWV, are found in most of Google’s tools, but where does that information come from and what does it measure?
Glad you asked!
The Core Web Vitals are a subset of an aggregate report called the Chrome User Experience Report, or CrUX. From that report, you can find out how the CWV of your site are performing and gain other insights about overall UX.
So what are the “Core Web Vitals” Google sees as the essential pieces of a well-oiled website and good user experience? The Core Web Vitals ranking factors consist of three main components of UX: loading time, interactivity and visual stability. These are measured using the following three metrics:
- Largest Contentful Paint (LCP)
- First Input Delay (FID)
- Cumulative Layout Shift (CLS)
Let’s dive a little deeper into what each of these three components is and what you can do to improve them when needed.
LARGEST CONTENTFUL PAINT (LCP)
It’s a mouthful, we know, and not an entirely intuitive term. It essentially refers to the load time of the visible page for a viewer. So from the instant a link is clicked, to the time that the largest element, image or block of text on the visible screen loads counts as the LCP on that given page.
Nothing below the fold is factored into this time.
The best LCPs are 2.5 seconds or less. Pages with quick load times, we know, typically rank higher in Google, but they also provide a much better UX–with better conversion rates and engagement (and we know that GA4 loves engagement!).
FIRST INPUT DELAY (FID)
This metric measures the time it takes for a page element to respond to a user’s input. It could be a form, a widget, a clickable tile or accordion drop down. These enhancements can make a page more engaging and entertaining, serving up content more creatively, however, they can also add lag.
The longer it takes for an element to respond to a prompt, the lower your FID score will be. Because this data can only be measured in the field (or by real user data), measuring is affected by internet speed and device capabilities.
Keeping the response times between 0 and 100 ms will get you the best FID score.
CUMULATIVE LAYOUT SHIFT (CLS)
Yes, another longish and non-intuitive phrase with real importance behind it. This is a score that is assigned by number, to indicate how visually stable your site is while it is loading.
Have you ever opened a site or page and went to click on a link or element, only to accidentally click on the wrong thing because the page wasn’t fully loaded and the elements weren’t where they were supposed to be yet? Yeah. We hate when that happens!
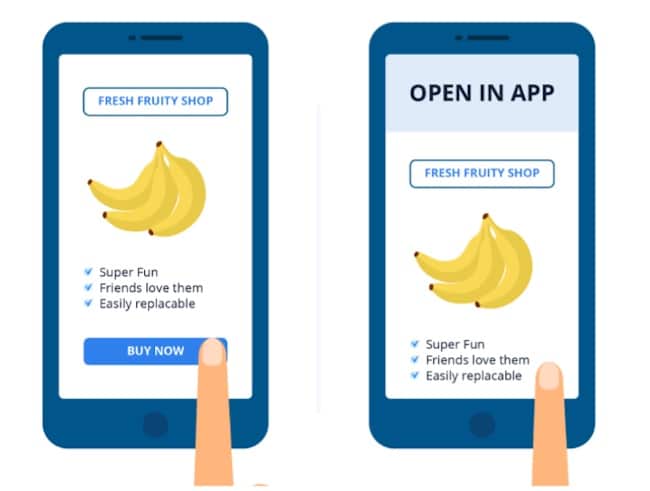
To make sure you’re not on the CWV naughty list, be sure to keep your score less than .25 (less than .1 is best).
| Core Web Vitals Metrics (UXometer) | |||
|---|---|---|---|
| Good | Needs Improvement | Poor | |
| Largest Contentful Paint (LCP) | 0 to 2.5 sec | 2.5 to 4 sec | >4 sec |
| First Input Delay (FID) | 0 to 100 ms | 101 to 300 ms | >300 ms |
| Cumulative Layout Shift (CLS) | 0 to .1 | .1 to .25 | >.25 |
Your Web Core Vitals are only as strong as your weakest link!
That means if you score “poor” on any one of the three metrics in the Web Core Vitals report, your overall score is also poor–so make sure to conduct frequent Core Web Vitals checks!
Where Can I Find My Core Web Vitals Report?
You can access the data for Web Vitals in all of the most popular Google tools:
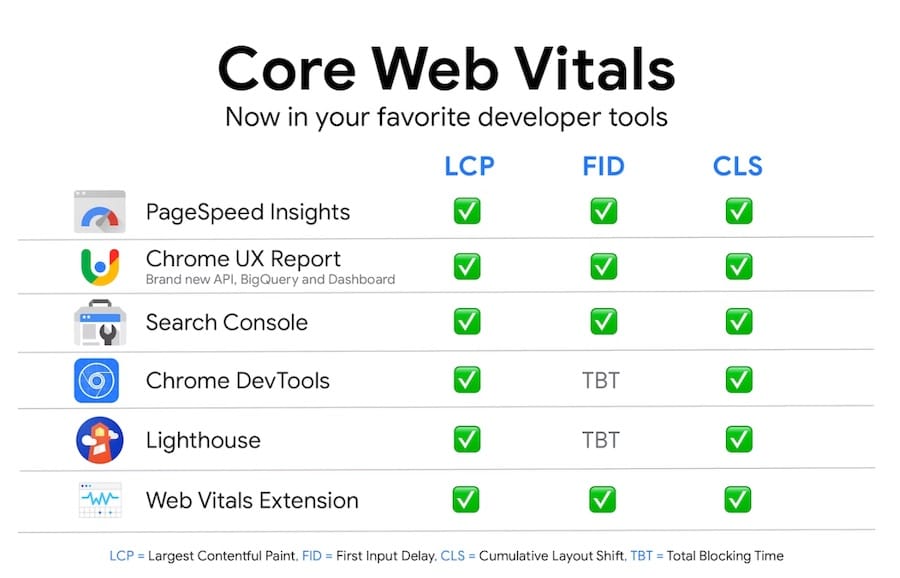
Another notable report that contains the CWV report in it is the Page Experience Report which can be seen in Google Search Console.
ANYONE CAN DO CORE WEB VITALS CHECKS
Whereas a nurse or doctor must take your vitals in a medical setting, Google has tried to make the Core Web Vitals accessible to anyone who has an interest in keeping them healthy. You don’t need to be an IT guy or a web developer to understand the basics of Google’s Core Web Vitals.

Google’s Core Web Vitals and the dev tools that report on and test them are meant to demystify issues that might otherwise seem “too techy to touch.” Anyone who works on, owns or develops the site can understand what Core Web Vitals are and how to test and improve them.
It’s highly recommended to look at both your mobile and desktop scores to create an action plan. Just remember, Google is a mobile-first indexing search engine, meaning that it will crawl the mobile site before the desktop site. Your priorities should be set on the mobile version over desktop even though both are important.
How to Improve Core Web Vitals
Let’s talk about how you can assess and improve your scores when they are in the red (or even the yellow).
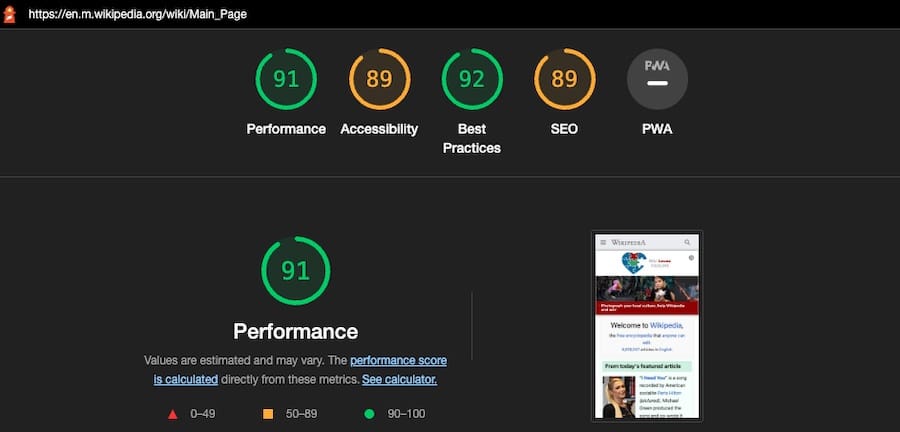
While the data set pulled from the CrUX report is field data, you can test your pages and apps using an open-source tool developed by Google called Lighthouse. It’s completely free and comes installed on Chrome under your DevTools area. We recommend using a private or incognito window to perform the Lighthouse report so that extensions don’t interfere with the simulated experience.
More information on Lighthouse here.
It is recommended that your first step is accessing your report in Google Search Console and determining which pages might need help. The Core Web Vitals report there pulls in field data so you know what a real user is experiencing. It should look like this:
Next, get both field and lab testing performed on those pages by using Google PageSpeed Insights, or PSI. This can be accessed directly or through your GSC account. The report should look like this:
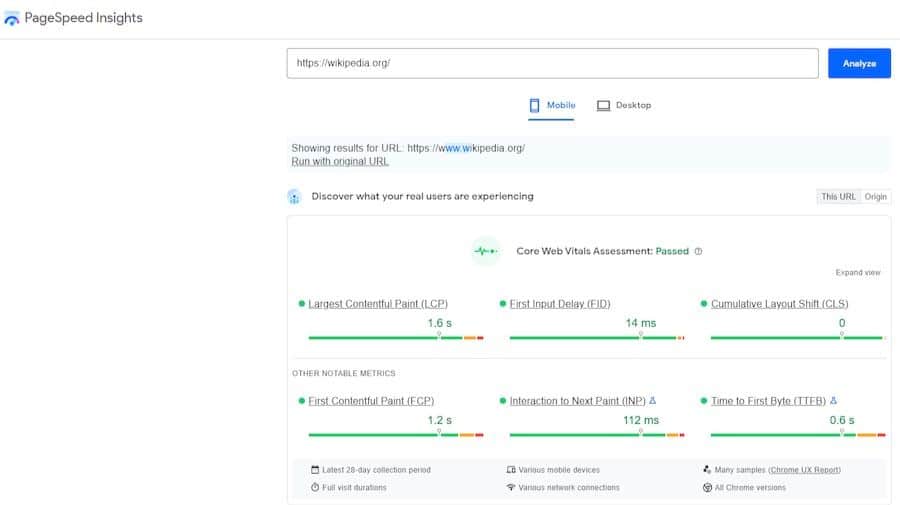
The lab results and testing allow you to simulate the metrics and gain valuable feedback.
Lastly, when you use web.dev tools or Lighthouse, your report will come with action items for you to perform to improve on weaker scores. If you need a little more help, web.dev/measure will use PageSpeed Insights (PSI) data to give you a prioritized list of codelabs and guides to get you optimized.
Those action items are how you can start improving your CWV!
Some things will come down to lazy loading your images below the fold, optimizing JavaScript and CSS, compressing image file sizes, fixing elements on the page that are causing CLS issues. Google’s Lighthouse report pretty much lays out everything you need to do to improve your score.
Here’s a list of the most common issues websites with low CWV scores have:
- General cumulative layout shift errors like images aren’t scaled with explicitly width and height
- Offscreen images aren’t being lazy-loaded
- Images aren’t served in next-gen formats (WebP, AVIF, JPEG 2000, etc)
- Unused JavaScript running
- Render-blocking resources running
- Need to minimize main thread work
- Need to reduce initial server response times
It gets deeper than this when you’re trying to actually troubleshoot what’s causing the errors. It could be your template, the CMS, a plugin, or any number of other problems. Whatever the case, once you fix the problem, track how much of an impact it made to your CWV performance score by clearing your cache and running the page through another CWV report using one of the tools listed previously.
That’s essentially it! Once you have a diagnostics/opportunities report in-hand, you’re just trying to find out which parts of the page are causing the most impactful problems.
But hey, as a marketing agency, we have ample experience with Google tools that help to improve your UX through reporting and testing. If you are interested in partnering with us for better online presence, site performance, conversions, ROI and UX, we welcome the opportunity to speak with you! Get a free audit performed on your website today!


