
3 Useful Ways to Pull Important Data with the AdWords Reporting Tool
by John Thuet


(photo by www.gotcredit.com)
You’re busy. Probably just as crazy busy as Chewbacca trying to fix the hyper drive before Darth Vader overtakes the Millennium Falcon. The last thing you want to do is spend hours sifting through last year’s data to come up with your marketing budget and goals for 2016.

Fortunately, Google’s relatively new AdWords Reporting Tool makes fixing your hyperdrive—er, evaluating your AdWords data—a relatively easy task.
Now, I love to take a whole bunch of confusing data and simplify/organize it in a way that clearly makes sense even to the non-analytical minds out there. If you use it right, the AdWords Reporting Tool makes this a cinch, so let’s take a closer look at 3 useful ways you can use this tool to analyze last year’s results.
By the way, if you are new to the AdWords Reporting Tool and would like a general overview of the tool, check out this great post my co-worker Jenny put together on the AdWords Reporting tool. It’s worth a read.
1. Day Parting
In preparing your 2016 AdWords campaign strategy, it’s best to really dig into your 2015 data. After all, you paid a lot of money for that information—you might as well use it!
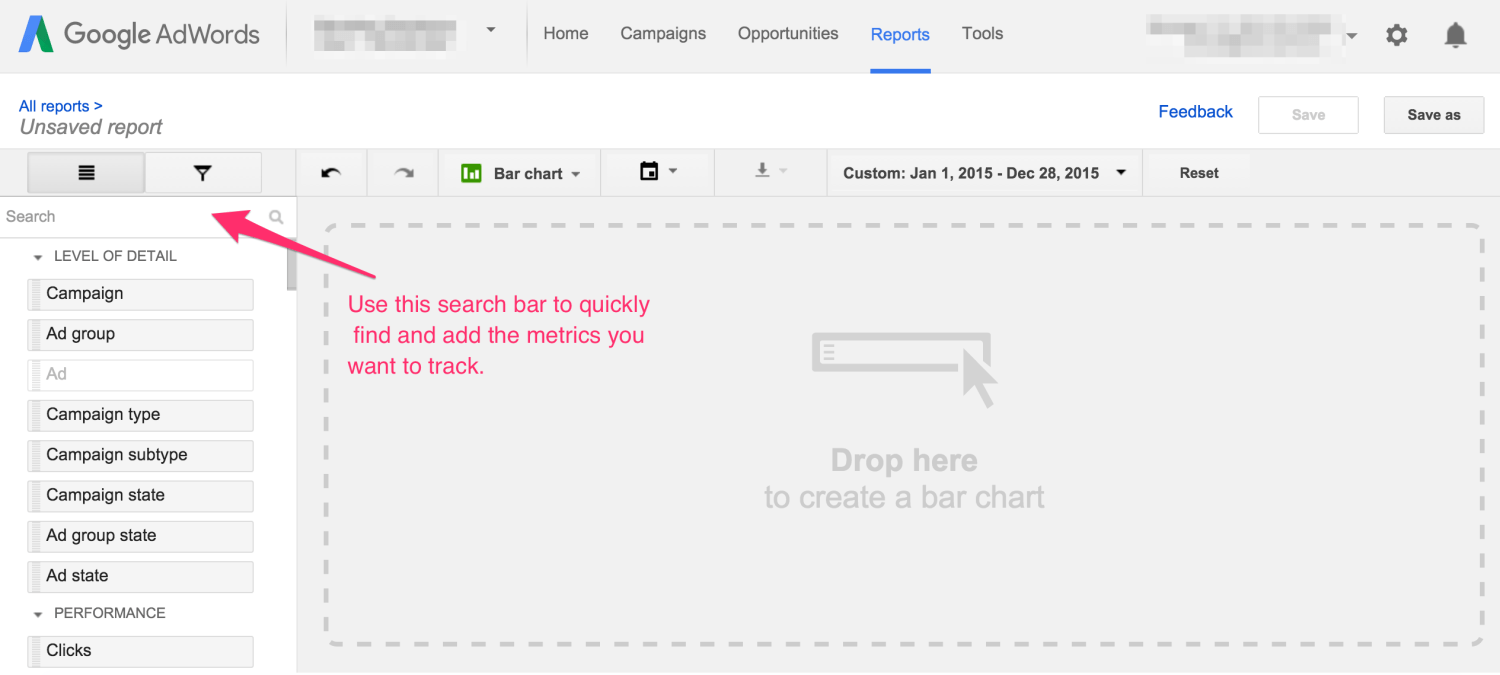
To do a quick Day Parting report, create a new bar chart and sort your data by “day of week”, “converted clicks” and “cost/converted click.” Set your date range to cover the broadest and most relevant data set possible.
For example, if your PPC strategy was fairly consistent throughout 2015, look at all of 2015. On the other hand, if you made significant changes partway through the year, look at the time window that best reflects your current strategy.
This date range should also be as long as possible (assuming that your data is still relevant), because the law of averages is really important in data assessment. The more data you have, the more accurate it will be.
By the way, here’s a quick tip for the reporting tool—the search bar at the top left is your best friend. There are A LOT of different reports you can pull with this tool and—rather than scrolling down—the search bar lets you simply type in what you’re looking for.
Here is an example of a graph I generated for a client using this tool. The client had good data for all of 2015, so my date range covers the whole year.
As you can quickly and easily see using this tool, Saturday and Sunday are our worst days: low volume and high cost/converted clicks.
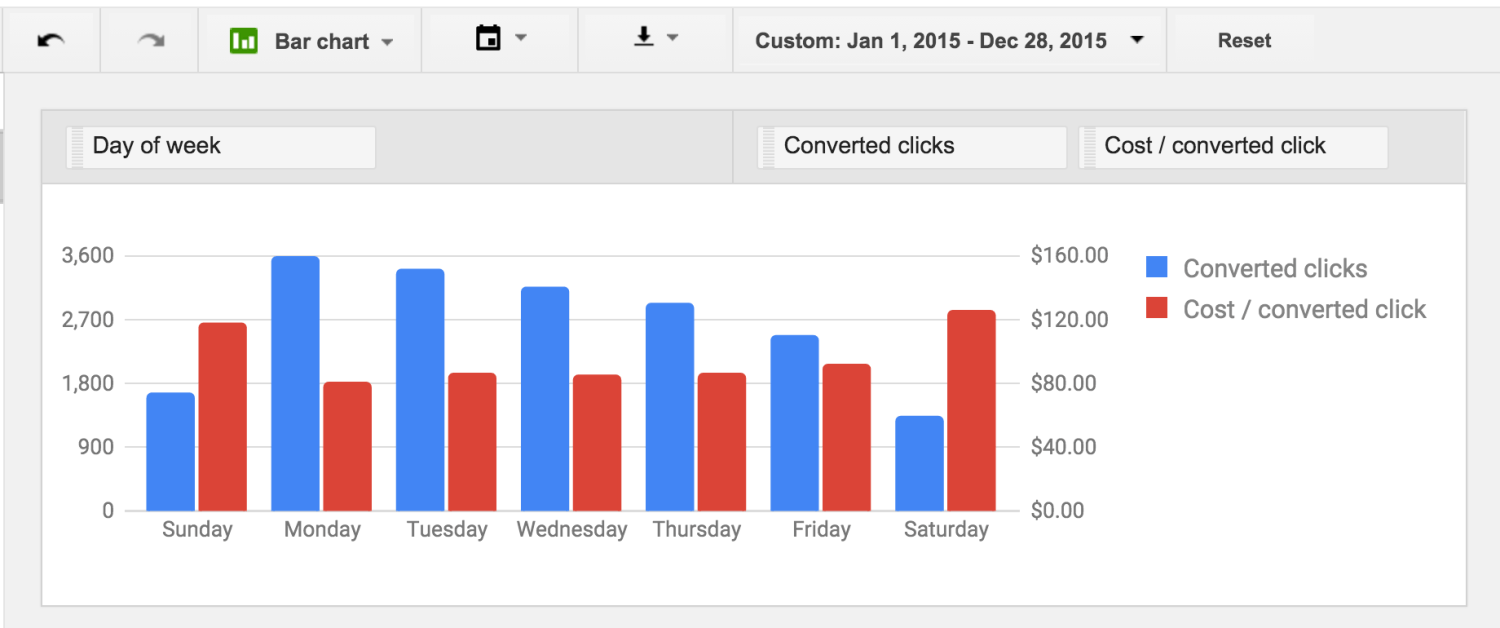
This chart raises a few important questions: Is the $120 CPL (as is the case in this example) sustainable? Should I turn off ads on Saturday and Sunday all together or just on a few campaigns or keywords? Are weekend conversions producing sales?
Modifying bid or campaign strategy based on Day Parting data can be a great way to improve the efficiency of campaigns.
Hour Parting
As with Day Parting, you can also quickly see if there are any hours of the day where you are driving significant traffic but failing to produce conversions. All you have to do is swap out “day of the week” for “hour of day.”
Here’s a look at the same client’s data from 2015:
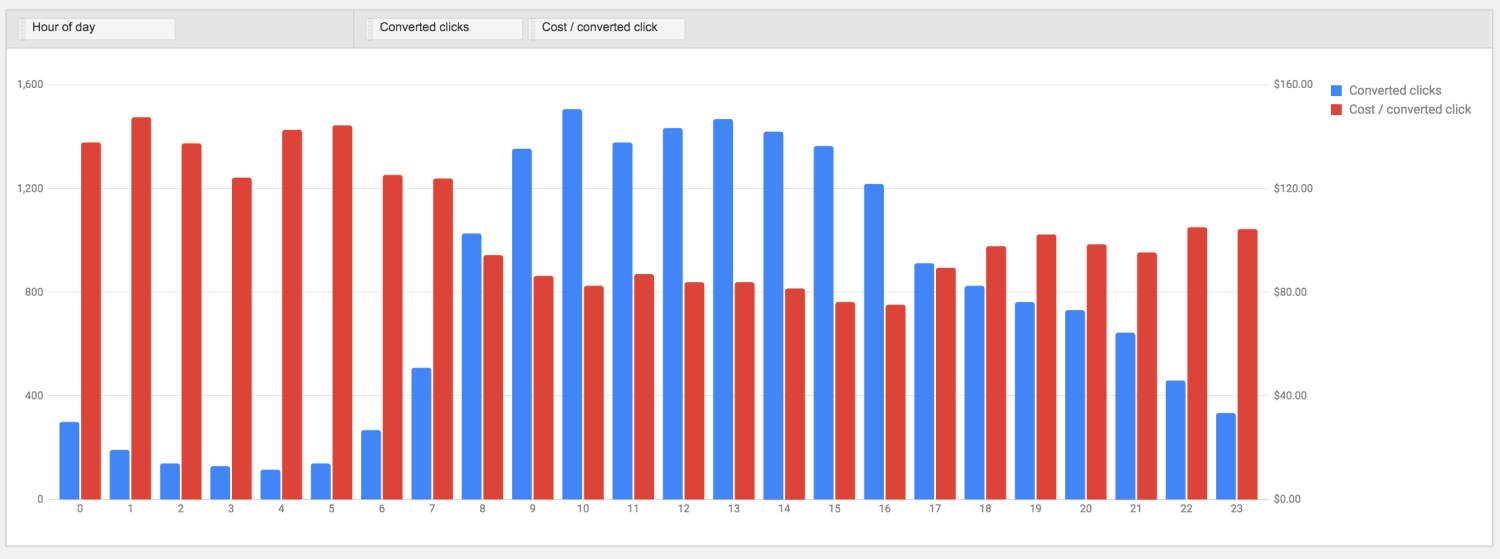
From this report, it’s pretty clear that I should probably only run ads from 8am to maybe 8pm-ish. Again, you can get this valuable information with just a few clicks.
Other Filters
The AdWords Reporting Tool makes it easy to find trends in your data. Now, in this post, we’ve only taken a look at day and hour parting based on the overall converted clicks and cost/converted clicks. However, you can use the same approach to compare many other metrics (average position, cost, CTR to name a few important ones) as well.
Another valuable way to look at your data is to filter by specific campaign. In the preceding examples, we looked at ALL campaign data for 2015. This is important.
For example, we saw that we should probably shut off all ads on Saturday and Sunday. But, by using campaign filters to look at that same data for each campaign, I was able to identify that only 3 of the 6 campaigns performed super poorly on those two days. So, instead of shutting down all campaigns on Saturday and Sunday, I only shut off 3 of the 6.
I also recommend taking a look at filtering by Device and Network. You can often use those filters to find huge opportunities (in particular, watch out for Search Partners—it either works super well or it’s a black hole for your budget).
Regardless of the particular filters you use, the AdWords Reporting Tool gives a quick and easy way to assess your data. Odds are, you’ll find a gem of an opportunity hiding in your 2015 results!
Conclusion
In the past, getting at this data took a lot more work. You had to export all your data to Excel and run a complicated pivot table to get a feel for what was going on. Fortunately for our busy schedules, this sort of data management is no longer necessary. A few clicks and filters and AdWords gives you an awesome look into last year’s results.
If you’d like some help working with the AdWords Reporting Tool, let me know here or in the comments! I’d be happy to help you look at your data and figure out how to improve your advertising for next year.
Now it’s your turn.
What sorts of filters or reports have you found particularly helpful in the AdWords Reporting Tool?


