
Statistical Significance in Marketing: Why Does it Matter?
by Trevor Anderson


In college, I took a statistics class where we spent a month and a half calculating probabilities of particular outcomes with playing cards. It was by far one of the most fun concepts to work with, and I was convinced it would become an incredibly practical tool of math for the rest of my life (confession, it hasn’t).
During that class, I also memorized the definition of statistical significance for a midterm exam. The calculation to find significance felt too complex for anything I was working with though, so I quickly forgot anything more than the definition.
After graduating, I began my work in digital marketing with the same goal many marketers have: “to test everything as fast as possible, and ‘growth-hack’ a business within months”.
If you’re chuckling after reading that, it’s because you’ve likely been in marketing long enough to know better. At this point, I do too. Good, data-driven marketing takes time, effort, and more than just knowing the definition of statistical significance to succeed.
An Academic View of Statistical Significance
The meaning of statistical significance is simple and straightforward, defined as:
“…the probability that a measured difference between two statistics is the result of a real difference in the tested variations and not the result of chance. It means that the result of a test didn’t appear randomly or by chance, but because of a specific change that was tested, so it can be attributed to a specific cause.”
Basically, it is the chance that the awesome results you found in a particular campaign or within a particular test will actually stick and not level out (or be detrimental) over time.
There are a couple ways to calculate significance:
- Go through the steps of calculating the standard deviations of two samples, calculate the variance of each sample, find a z-index and compare it to a t-score table to determine whether a result lies far enough away from the middle to be determined to be significant.
- Use a calculator which will calculate significance for you, like this one.
If you’re calculating significance as a percentage, you want it to be as high as possible (if you leave a p-value in it’s true form, the goal is to see it as low as possible). For academic research, 90-95% is generally interpreted as the threshold. That is, there is a 95% chance that your results are due to a difference in user behavior caused by your variable, with a 5% chance of the observed difference being due to chance.
If the data reaches that level of significance, it is said that there is sufficient data to reject the null hypothesis, where the null hypothesis is the point we want to disprove (ex: in a test where I change the color of a button to several different hues, my null hypothesis would be that the color of the button does not matter. I want to disprove that notion).
On the contrary, if the confidence level comes in at less than 95% in a thorough study, it would be said that there was insufficient evidence to reject the null hypothesis and the researcher should retest with a new set of variables, or pick a new null hypothesis.
A Marketer’s Take on Statistical Significance
Okay, but what does this mean in the digital marketing realm?
The short answer is this: if testing a particular variable does not result in a data set with a high level of statistical significance, your marketing dollars and website are at risk. The reverse is true, too. If you do not measure significance for every result, you may miss out on a valuable opportunity.
For example, on one of the large ecommerce sites we work with, our goal was to improve the rate at which users visited product page from the Men’s apparel category. We knew that the quicker someone found a product they liked, the more likely they were to complete the conversion process on their first visit.
We hoped for a large improvement and were relatively disappointed when the results didn’t show a large change. In fact, prior to analyzing the data at a deeper level, we assumed this wouldn’t be a good direction for us to take at all.
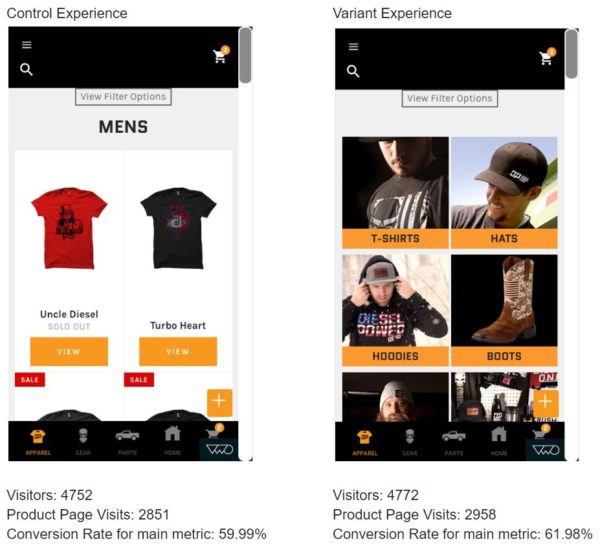
Null hypothesis (current state): the styling of the filtering options has no impact on the ability to search and find desired products.
Alternate hypothesis (what we want to prove): More robust filtering options will play a key role in helping people find what they need quickly and convert on their first visit.
As you can see above, the lift in conversion rate for our Variant Experience wasn’t very big. In fact, the conversion rate increased by a measly +3.31%.
But, when we passed this data through a significance calculator, we discovered that our results had a 98% statistical significance. That means there is a mere 2% chance of the observed difference being due to error.
With that in mind, this test takes on a whole new meaning. While the result was not massive enough to revolutionize the user experience, by calculating the significance of the data set, we can rely on any learnings derived from the test and move forward with a new set of hypotheses that pushes the envelope even further.
While 3.31% isn’t massive, the ability to be confident in the improvement shown in the test means we can look forward and project a conversion lift that will bring in tens of thousands of dollars over the next 6 months.
Not Seeing High Significance?
In the Harvard Business review, Tom Redman echoes many of our sentiments on the true value of significance in marketing. He says:
“If you’re searching for the Higgs boson, you probably want an extremely low p-value, maybe 0.00001. But if you’re testing for whether your new marketing concept is better or the new drill bits your engineer designed work faster than your existing bits, then you’re probably willing to take a higher value, maybe even as high as 0.25.”
So, before you give up on that experiment that is sitting with 80% significance, consider the following:
How Long Has the Test Been Running?
If it’s shorter than the buying cycle of an average customer, leave it up longer and check again later (personally, I never call a test with less than 2 weeks of data)
How Large is Your Sample?
If your sample is under 1,000 visitors, think carefully about calling a test (several thousand visitors to each group will always reduce the variance in your sample). The smaller a sample is, the more variance you’ll naturally have within your data set. If you’re dealing with low traffic pages, try some of the ideas found here.
What Does Your Trendline Look Like?
If the conversion trend for one of your experiences is consistently outperforming the other—especially if the gap is widening over time—you may be on the right path. Keep tweaking and testing—you’ve probably found something that will truly improve your conversion rate.
Likewise, if you’re waiting for a data set to be ready to interpret and the trendline for the ‘better performer’ is totally erratic, be wary before proceeding any further down that path.
Consider Your End Goal
If you’re running an A/B test on a homepage, you’ll likely have your eye on the bottom line revenue as one of the metrics you need to report on. But, if the overall conversions are stagnant or difficult to interpret, it may make sense to start watching micro conversions (user progress to the next step), as well as macro conversions (purchases, in this example).
That way, if you start seeing some significance with smaller goals, you can incrementally test different parts of the conversion funnel to ultimately find the step with the largest impact on that end goal.
Conclusion
While many tests will fall flat, no analysis should be considered ‘finished’ without running through some basic calculations to determine whether or not the results are significant.
Before risking big money on a new business strategy, ad set or site design, try running some quick calculations. It’s the best way to make sure you know how big of a risk you are taking in moving forward. Because whether or not a variable is able to cause a result large enough to reject the null hypothesis, the grand majority of tests and variables should provide information that can point you in the right direction.
And, while it certainly wasn’t the most interesting topic to cover in college, you may find that calculating significance really becomes the most practical skill you have as a marketer.
By the way, if you’d like help setting up your own website tests or assessing your results, let me know here or in the comments. I’d love to help!
How do you use statistical significance in your website testing? Did this article help answer your questions? Leave your thoughts in the comments.


