
Ecommerce Analytics: Understanding Funnels, Tracking Pixels and More
by Ana Gotter • May 31, 2018


Right now, do you know exactly what your highest performing products are? Do you know exactly how much revenue they’re bringing in, or what they’re frequently purchased with?
What about how someone interacts with your business before purchasing? Are they coming to your site from social media, or email, or somewhere else? How many site visits does it take before they’re ready to convert?
Ecommerce businesses need to keep up with a lot of information, both in terms of how their products are selling and how their marketing efforts are impacting sales and other brand goals.
Analytics matter and—when it comes to ecommerce analytics—there are a lot of different tools that you can use to find and monitor all of this information on a regular basis. In this post, you’ll learn about what you should be tracking with ecommerce analytics and how to do so.
Different Analytics Platforms You’ll Need
If you start Googling different analytics platforms, you’ll be find countless search results. There’s a lot of great third-party tools, but for this post, we’re going to stick to the basics.
These are the analytics platforms that most ecommerce businesses should be using:
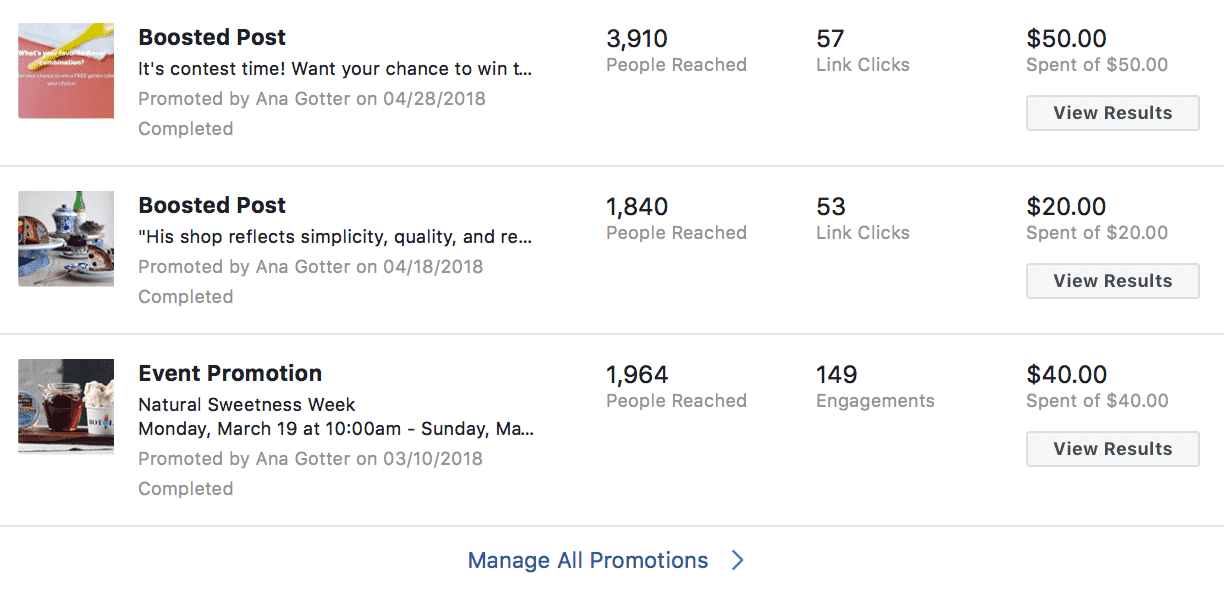
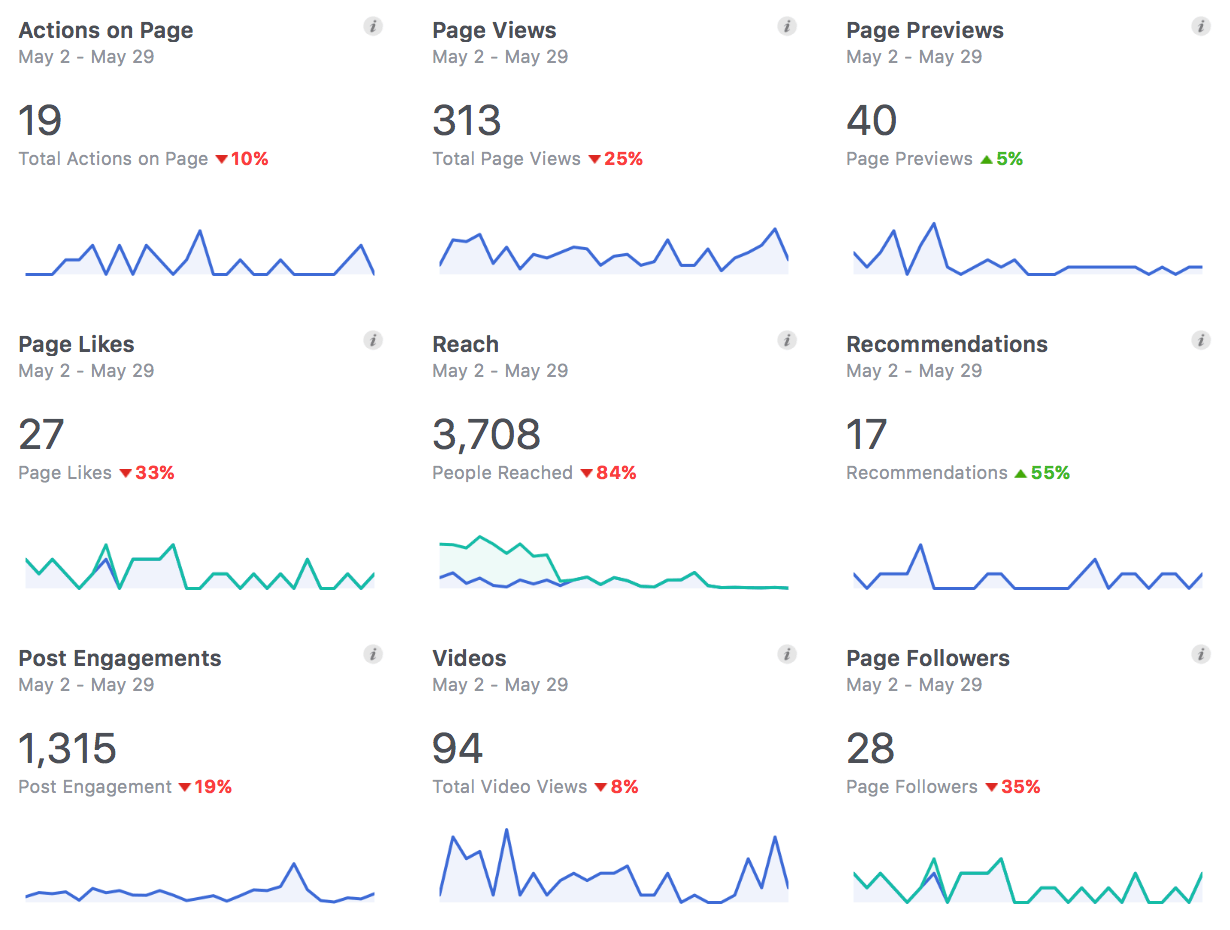
- Native social media marketing analytics platforms, like Facebook’s Insights, which will show you on-platform engagement.
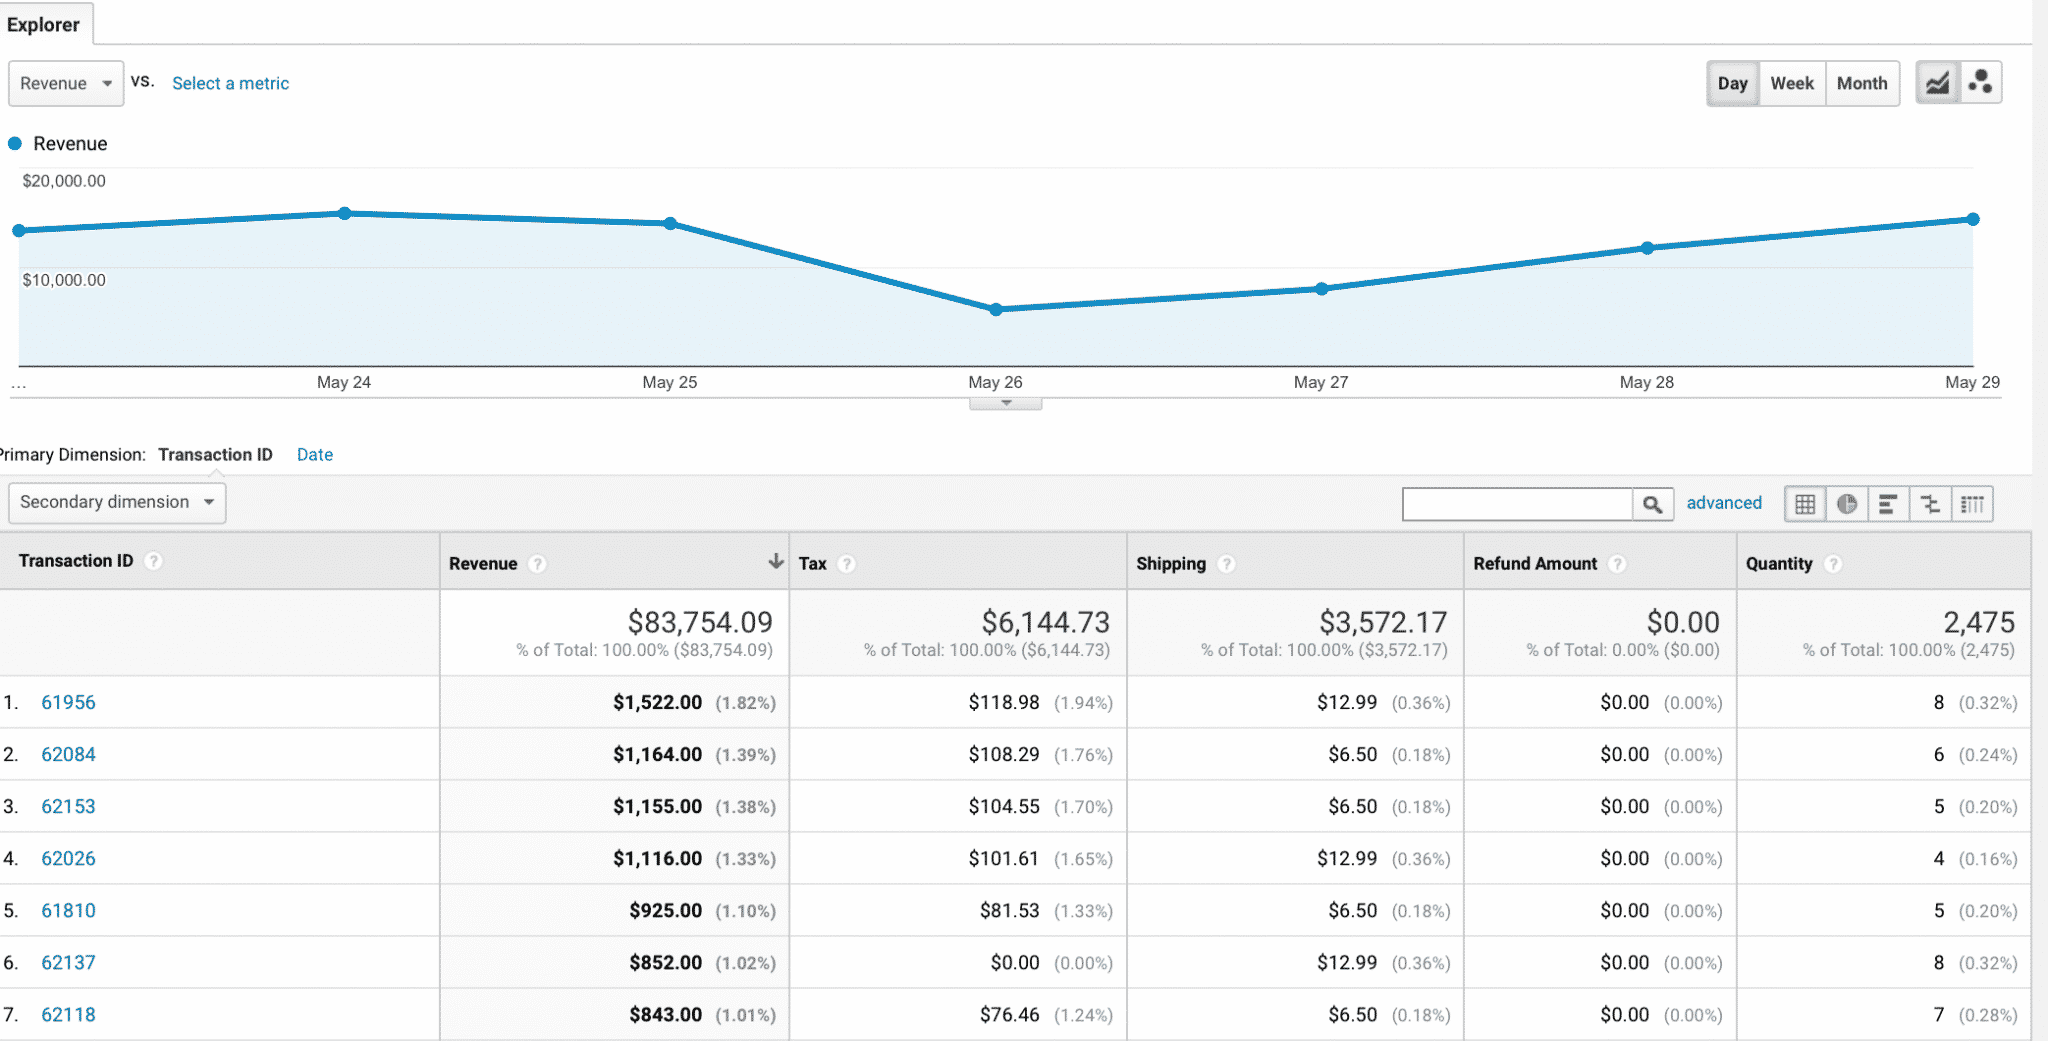
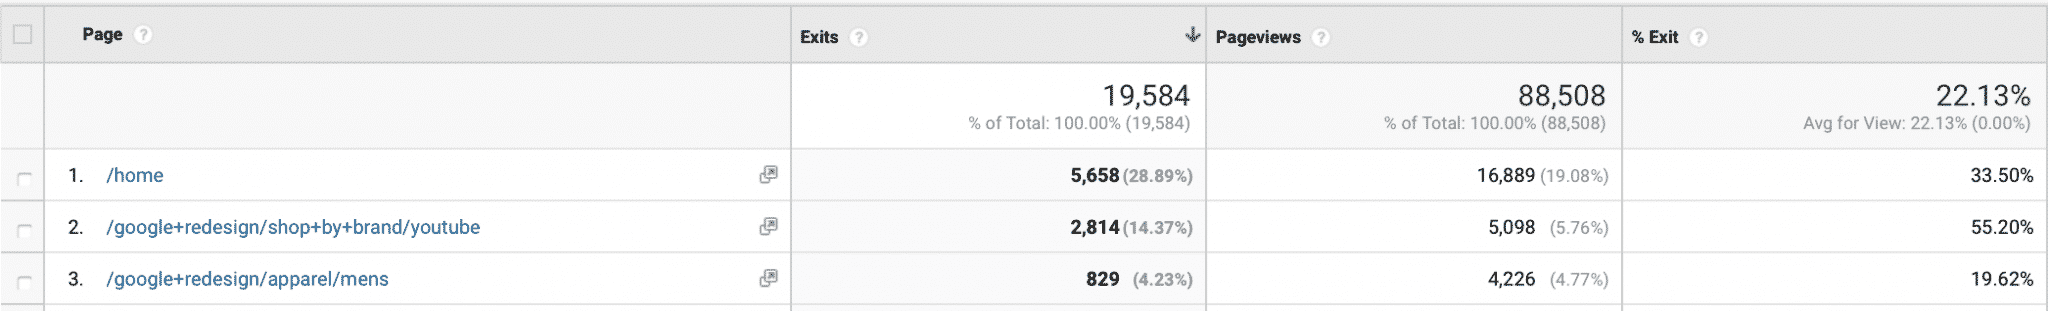
- Google Analytics, which can show you definitive information on sales and transactional data.
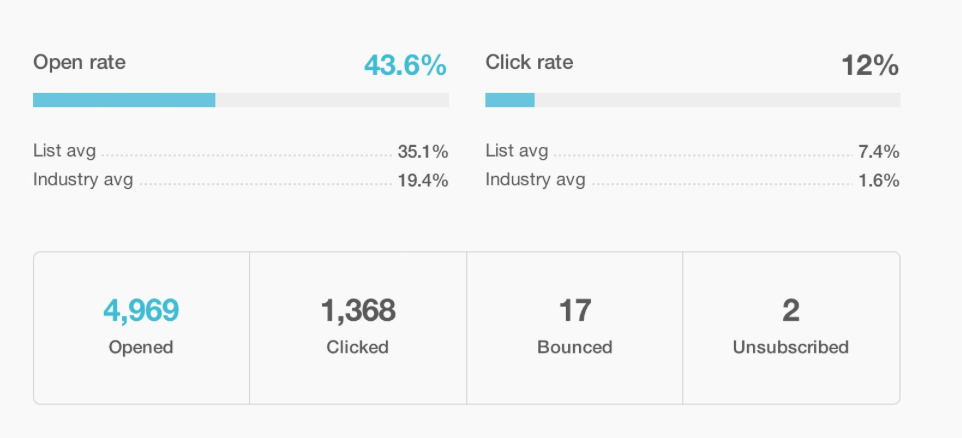
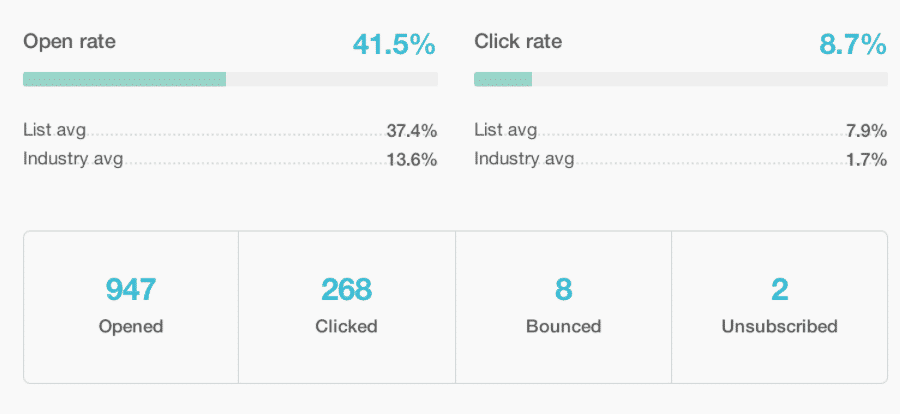
- Your email software’s analytics program (like MailChimp), which can show you things like open rates and CTR.
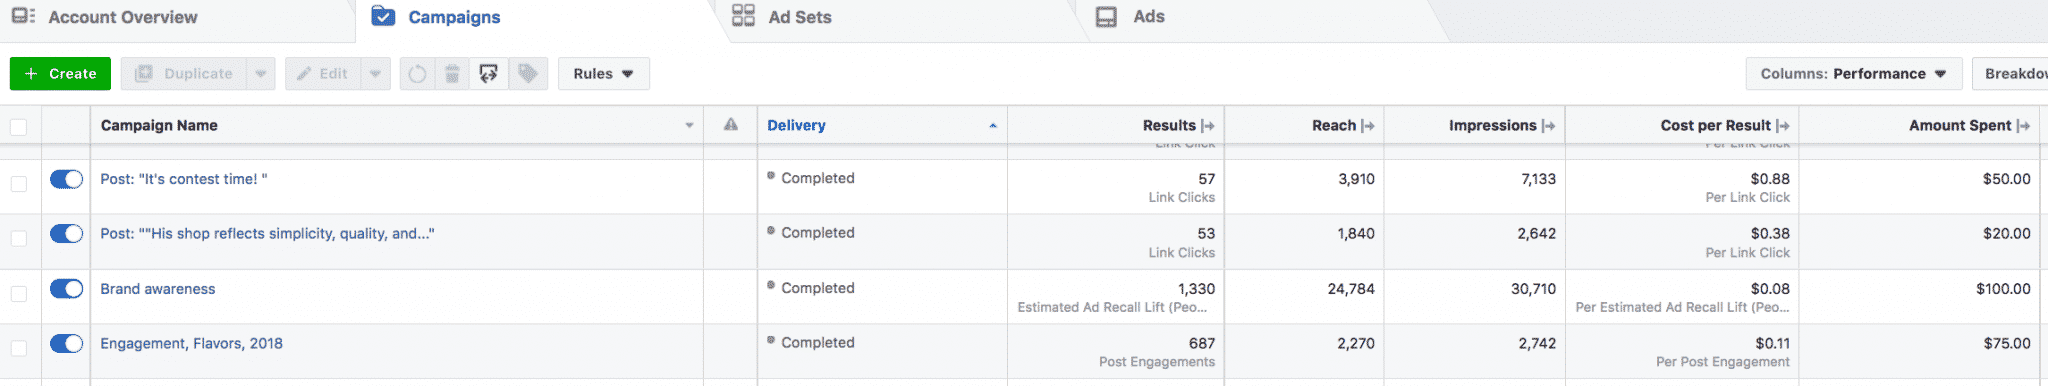
- Ads Manager reports for the PPC systems you use, including Facebook’s Ads Manager and Google AdWord’s dashboards
Each of these analytics platforms will give you individual information you can’t find anywhere else, like small pieces of the puzzle that you need to put together on your own.
Isn’t Google Analytics Enough? Why Do I Need All of These?
Google Analytics can tell you a heck of a lot, especially when it comes to ecommerce businesses. You can get an idea of where your traffic is coming from and what’s triggering conversions and purchases. That’s excellent.
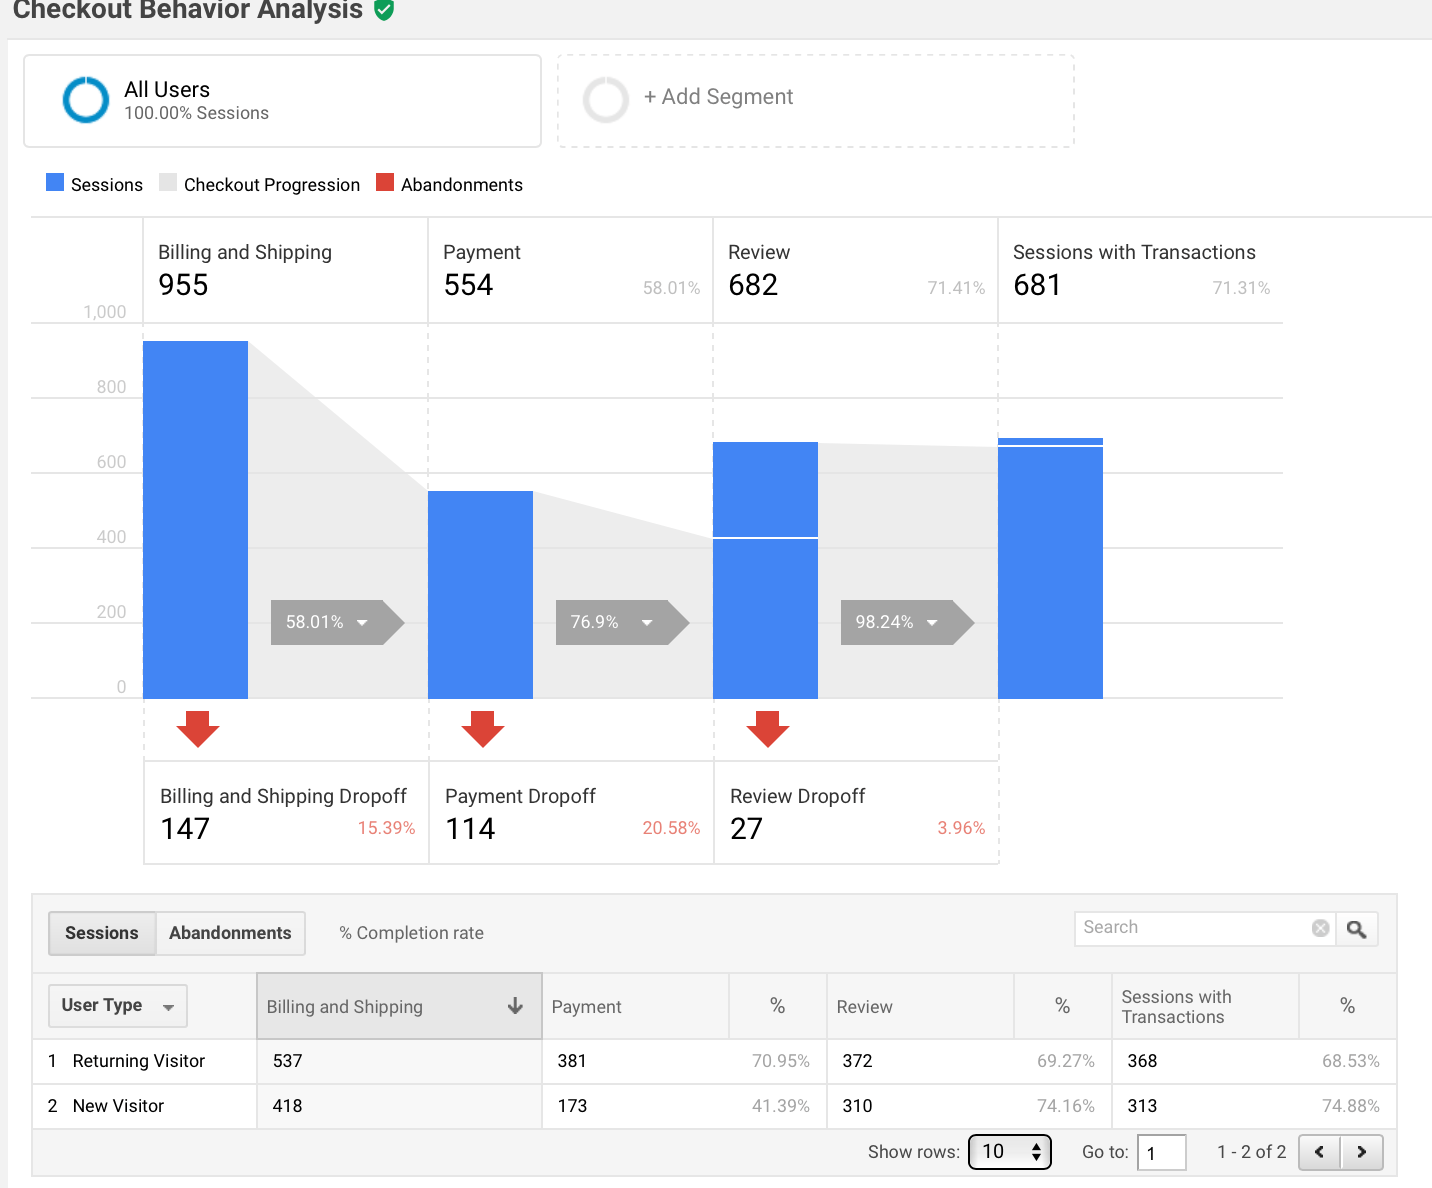
Google Analytics won’t be able to give you a full and accurate look at how users are moving through your different funnels, however, because most funnels don’t live exclusively on your website.
Most funnels, after all, are strategic steps designed to push users through the digital sales funnel and get them from Point A (which could be anything from social media to an offer shared online to an email) to Point C, D, or E—which is where they convert.
Your funnel may look something like this:
- Users see a Facebook post or a Facebook ad about a new product you’re offering. They watch the video.
- They click to learn more.
- They’re taken to a designated landing page. They have the option to add to the cart or to get more information on your company. They aren’t ready to convert, so they choose the latter.
- They’re given more in-depth information about the product, and then feel secure about purchasing.
- They add the product to the cart.
- They checkout.
Multiple analytics tools will ultimately be needed in order to get an accurate idea of how users move through the funnel.
Maybe they had to see multiple Facebook Ads, and finally converted after they saw a video. Maybe an email was partially responsible for sending them there. And, if that’s the case, getting information from Facebook Ads or your email software about the effectiveness of different campaigns is crucial.
Just as importantly, only Facebook’s Ads manager can tell you exactly how much you paid per click and whether the amount spent on your campaign was worthwhile.
These costs will affect your bottom line, and if you’re paying $12 per click but only half convert and your profit margin pre-cost is only $20, you’re losing money. Without this information, though, all you’d see was conversions, not realizing that the costs were destroying your ROI.
What Should You Be Tracking?
Each marketing campaign should have KPIs that are based on the campaign’s goals, and all goals will eventually lead back to the ultimate priority of driving more sales. Sometimes these goals do this by focusing on lead generation or brand awareness as the primary goals, in which case you’d measure lead sign ups and reach, respectively, as KPIs.
On each platform, in addition to measuring KPIs for specific campaigns, you also want to be watching for overall campaign effectiveness and potential problems that need troubleshooting.
Let’s look at a few examples and how to troubleshoot them…
- If lots of users are clicking on your Facebook Ad but then having a high bounce rate on the landing page, ask yourself: why? Is the landing page not enticing enough, or not loading fast enough, or not relevant enough to the ad? Are you targeting the wrong people?
- You’re posting regularly on social media, but your overall reach has gone down. Maybe that’s due to an algorithm change, but it means that less people are seeing your posts, which means less people converting. You may need to compensate with increased paid posts.
- You realize that your email marketing campaigns are most effective at sending you direct sales, but you also notice that your email open rates or CTR rates are actually low overall. After some investigation through the analytics, you realize that only emails containing offer codes and/or personalized suggestions are getting you results and all the other campaigns are weighing you down.
- It’s clear that there’s lots of traffic moving through your site and even following your established funnel on Google Analytics, but you aren’t seeing the sales you’d expect. You realize that 25% of users are abandoning their cart on the shipping and handling page, and discover that the wording is confusing and makes it look like users will be paying more than they will.
Again, this is all about getting a full-picture look. You won’t be able to get this without seeing all the data from each platform, because there’s no other way to get all the data together, period.
Conclusion
In order to gain a full, comprehensive understanding of what’s happening with your ecommerce business, you need to be using the analytics tools discussed in this post to see what’s happening at every potential touch point.
Google Analytics, after all, is exceptionally helpful, but it’s not enough on its own. It can’t tell you which Facebook posts are most effective at driving sales, or which email campaigns yield the highest average purchase value. Utilizing all available analytics programs, however, lets you see how the puzzle pieces fit together, allowing you to see the big picture.
By the way, if you’d like help implementing or interpreting your ecommerce analytics data, let me know here or in the comments. I’d love to help!
What do you think? Which ecommerce analytics platforms do you use for your business? Are there any third party tools that you’d recommend? Share your thoughts and questions in the comments below!


