Be in the Know: 2019 PPC Statistics You Should Know
by Cydney Hatch • December 11, 2018
2018 was a huge year for PPC marketing!
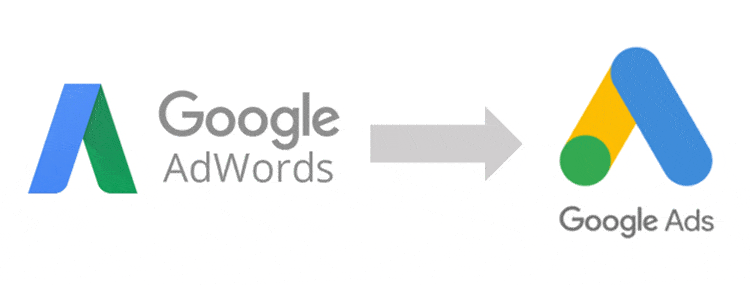
There were massive changes over at Google with AdWords being rebranded as Google Ads, the new Google Ads interface and the launch of numerous new campaign types, features, enhancements, targeting options and tools.
 Meanwhile, we saw big growth for platforms like BingAds and LinkedIn while Amazon gave Google a run for their money as advertisers shifted their budget toward Amazon.
There have been a lot of PPC developments in 2018, so 2019 is the year to see a lot of these massive changes come to fruition.
As 2019 is approaching, now is the perfect time to review and implement new PPC best practices to start improving your performance. To start, here are some general predictions for 2019:
- Increase in PPC budgets
- The rise of Artificial intelligence
- The rise of Programmatic Advertising
If that has piqued your interest in learning more about the future of PPC and to improve your campaigns, let’s take a look at some 2o19 PPC statistics you can use to share your future campaigns for success!
2019 PPC Statistics
Before we dive into these PPC statistics, here are a few helpful numbers to put these statistics in perspective: The world population is 7.7 billion and the internet has 4.1 billion users.
General PPC Marketing Statistics
- Just under half of American citizens—46%, to be precise—pick up and unlock their smartphones to check for notifications upon waking up each and every morning.
- 2018 to 2019, the total number of devices around the world with ad blockers rose from 142 million to upwards of 615 million.
- From 2016 to 2017, roughly 7% of people viewed pay-per-click ads poorly, meaning they associated them with negativity. From 2017 to 2018, on the other hand, only 1% of consumers held negative connotations to this type of advertisement.
- An astounding 86% of all American consumers regularly utilize the World Wide Web to search for local businesses that match their particular wants and needs.
- According to SocialMediaToday, more than 7 million advertisers invested a total of $10.1 billion in PPC ads just during 2017.
- Internet traffic funneled through pay-per-click advertisements bring approximately 50% more lead conversions than organic web traffic.
- 2019 will be an amazing time for ecommerce brands because they will have more opportunities to reach buyers with greater personalization and precision.
- 46% of Internet users can’t readily tell the difference between PPC ads and links returned organically from searches.
- The top 3 paid advertising spots get 46% of the clicks on the page.
- PPC salary survey males are employed at a 8:1 ratio to females across the globe.
- Industries spending the most in PPC in 2017-18 were retail, education, publishing and travel.
- Industries spending the least in PPC in 2017-18 were home improvement, consumables and automotive.
- 40% of brands and agencies say that their PPC budget is lower than where they actually want to be.
- 40% of brands want to increase their PPC budget, indicating that this is an effective and lucrative tool for marketers.
- According to Formstack, PPC ads are one of the top three generators of on-page conversions.
- 65% of all clicks made by users who intend to make a purchase go to paid ads.
- More than 40% of consumers use their smartphones to conduct research while inside a brick-and-mortar store.
- 76% of people who search for something nearby on a smartphone will visit a business within one day.
PPC Platform Statistics
- The top PPC search engines in order are Google, Yahoo and Bing.
- Internet users spend one-third of their time online across social media platforms like Facebook and Twitter.
- Google Ads and Facebook PPC Ads are the two largest advertisers on the Internet. To be exact, Google currently holds 37.2% of the digital advertising market, whereas Facebook holds 19.6%.
- Advertisers are currently more likely to experiment with Bing than keep 100% of their ads on Google’s platform.
- From the fourth quarter of 2018 to 2019, the total volume of Bing’s search traffic via mobile users exploded by a factor of seven!
- Bing’s CPC increased 6% in 2018.
- 63% of website visits are abandoned if a mobile site takes 3 seconds to fully load or more.
- Sites that load within 5 secs vs 19 secs were observed to have 70% longer average sessions.
- 46% of consumers say that waiting for pages to load is what they dislike the most when browsing the mobile web.
- Mobile devices account for 53% of paid-search clicks (just one more reason to optimize your campaign for mobile advertisements).
- Facebook may have overestimated video viewing time over 79%.
- Facebook’s US Ad Revenues ($21.57 billion this year) will be twofold the amount spent on newspaper advertising ($10.74 billion). This will be close to the amount spent on entire print category ($23.12 billion). They even predict that the social media giant will move ahead of the print.
- Instagram, LinkedIn and Pinterest will remain relatively easier to win on, in terms of spending to expand your online presence.
- 65% of advertisers say that programmatic has become an important PPC channel of digital ad industry over the last 12 months.
- 40% of in-store purchases begin online.
- Statistics from the fourth quarter of 2018 indicate that Bing’s average price per click rose about 6%, whereas that of Google dropped 13% in the same time period.
Google Ads 2019 Statistics
- Consumers make more than 160 billion searches per month on Google alone.
- Google Ads alone reaches a network of more than $2 million websites and applications
- Roughly 36% of mobile searches are local and performed using Google.
- Startup small Businesses earn $3 in revenue for every $1.60 they spend on Google AdWords.
- 74.5 % of all computer-based searches are entered into Google.
- The average business turns $3 in revenue for every $1.60 they spend on Google Ads.
- People who visit websites via pay-per-click links on Google’s search engine results page are going to purchase something from your page about 0.5 times more frequently than visitors who found their way to your web page via Google’s organic results.
- Statistics indicate that brand awareness can effectively be grown through nothing but paying for exposure on Google’s search engine results pages for search users that will most likely fit your target demographic. Just one brand awareness campaign, when done correctly, through paid Google ads can boost the metric up to 80%.
- 40% of all clicks made on Google’s search engine results pages (SERPs) go to each page’s top three advertisements.
- Approximately two-thirds of people who click on Google’s PPC advertorial showings do so when they search for things related to purchasing products.
- ‘AdWords’ Google Ads trends search volume has gained 39%.
- Cell phone listings work: 69% of searchers that are mobile call a business straight from Google Search.
- Google reports that search ads can boost brand awareness by as much as 80%, making consumers more likely to remember your brand and interact.
- Roughly 52% of people shopping online prefer to click on paid advertisements atop Google’s search engine results pages.
- The average click-through rate across all industries on Google Ads in 2018 is 3.17 on the Search network.
BONUS: 2018 Google Algorithm Updates to Master in 2019
- “Brackets” core update – March 2018 – According to Danny Sullivan’s Twitter page, @searchliaison, some sites may have seen drops or gains, stating: “There’s nothing wrong with pages that may now perform less well. Instead, it’s that changes to our systems are benefiting pages that were previously under-rewarded….”
- Zero-result SERP test – March 2018 – This was a failed update, which was quickly terminated after a week of testing. For date, time, and conversion calculations that only require one concrete answer, Google started displaying zero search results with a “see all results” and displayed the answer on a short knowledge card.
- Mobile-first index – March 2018 – Finally rolling out after months of build up and announcements on the importance of an optimal mobile experience, Google started migrating sites after a year and a half of testing.
- Unnamed core update – April 2018 – Confirmed by Google but not named, this improved certain site ranking or had little or no negative impact. They stated this type of core update happens several times a year.
- Snippet length drop – May 2018 – Earlier in the year, meta descriptions in SERPs had been increased to 300+ characters, allowing for a more descriptive sentence or two about the nature of the content. However, this has been reverted back to approximately 150-160 characters. Although it gave copywriters and SEOers more space to place with and potentially increase real-estate on SERPs, it also gave less experienced marketers a chance to “keyword stuff” instead of providing concise descriptions.
- Video carousels – June 2018 – Video in SERPs. is taking an interesting direction. Video carousels have been rolled out on desktop after having been tested and featured on mobile SERPs and in knowledge panels over a year ago.
- Mobile speed update – July 2018 – Officially confirmed, Google now uses page speed as a ranking signal in mobile search ranking. This comes with the understanding mobile users are on the move, in a hurry and need answers quickly. This initially is set to just affect pages that deliver the slowest experiences to users and only affects a small percentage of queries.
- Chrome security warnings (full site) – July 2018 – This was no shock to marketers since Google has repeatedly stressed the importance of secure sites, with many warnings throughout the year that non-HTTPS sites would be penalized and warning messages would appear to users.
- “Medic” core update – August 2018 – Widely reported by Moz and confirmed by Google, their broad core algorithm update in August caused numerous fluctuations in ranking and traffic across many verticals. However, it seems those that were hit hardest by the update were in health and fitness.
PPC Content Statistics
- Video ads are clicked 73% more than display banners.
- 66% of buyer-intent keywords are paid clicks.
- 36% of searches on Google are associated with location (two of every five Google web searches).
- The keyword “insurance” is the most expensive keyword: Prices on average are over $59 per click! “loans” and “mortgage” would be the next highest in CPC (Cost Per Click) spend at around $30-6/click.
- 90% of AdWords suspensions can be fixed.
- 40 minute average viewing sessions of mobile devices on YouTube.
- The most effective PPC channels in 2017-18 were: text ads, remarketing, mobile, social, shopping, and display.
- 80% of repondents state that Artificial Intelligence was an important aspect in the digital industry during 2018.
- Three out of four people who find helpful information based on their location consider visiting brick-and-mortar stores.
- 90% of consumers say they trust online reviews.
- More than half of all searches are longer than four words.
Now You Know!
Knowing the growing trends of any marketing will greatly improve your chances of success.
PPC statistics, in particular, offer important insights you can use to guide your content and client acquisition strategies. By understanding these numbers and looking at your own PPC analytics, you can learn everything you need to manipulate and highlight effective marketing strategy around what your customers need to see with your ads in the coming year!

If you want some help with your 2019 PPC advertising, don’t be shy and reach out to me here! PPC advertising is our bread and butter at Disruptive Advertising, so we might know a thing or two about how to make yours more effective!
What do you think? What is the future of PPC advertising? Does Amazon have the chance at beating out Google ads? Comment below and share your predictions!

