Google to Add Quality Score Columns to AdWords Interface?
by Aden Andrus • April 19, 2017
For well over a decade, AdWords Quality Score has been a bit of a mystery. Google has published some content on Quality Score and you can see some information on your current Quality Score in the AdWords interface, but tracking and improving your AdWords Quality Score has always been a painful guessing game.
Times may be a’changing.
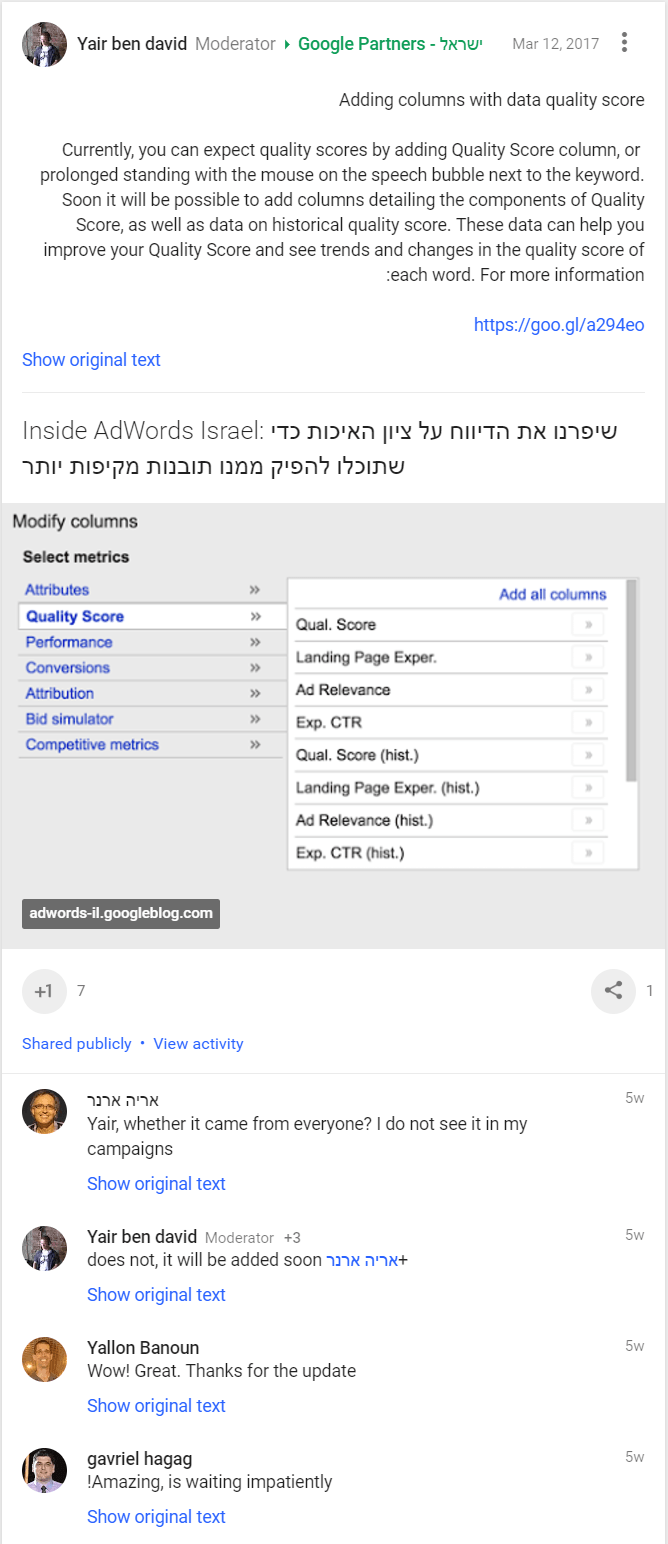
About a month ago, Avner Pinchover published a blog post on the Inside AdWords blog describing several new Quality Score columns that will soon be added to the AdWords interface.
As you can see below, the post received very little attention and has since been taken down, but it does look like Google has new Quality Score columns in the works:

At present, current Quality Score is the only metric advertisers can directly add as a column in AdWords. You can see Expected Click-through Rate, Ad Relevance scores and Landing Page Experience scores by hovering over a pop-up icon, but—outside of the AdWords API—the data isn’t directly available.
Since you can only see your current scores, it’s very difficult to see how changes in your ad copy or landing page experience affect your Quality Score. To help with this, there are a number of AdWords scripts you can use to track Quality Score over time, but these require a certain level of technical expertise to implement and troubleshoot.
Hopefully, that will soon be a thing of the past.
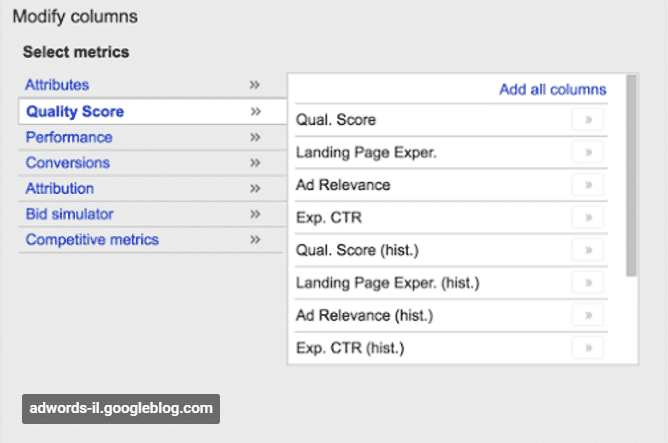
In the image above, Google seems to be working on making your current Quality Score, Expected Click-through Rate, Ad Relevance Scores and Landing Page experience scores easily accessible. That’s great, but what’s really exciting is the historic data Google seems to be willing to finally track for us in each of these areas.

From the looks of the scrollbar this screenshot, Google seems to have several other Quality Score columns in the works as well, so it will be interesting to see what other sorts of columns Google throws into the mix.
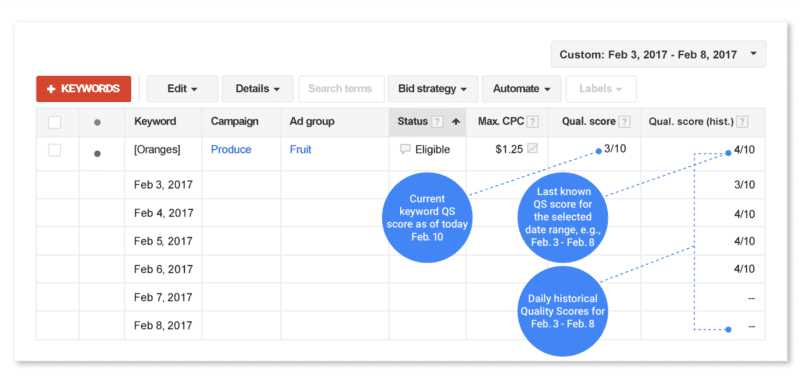
There are a variety of ways to use this data, but one obvious application Avner suggested in his article was looking at Quality score changes by day:

As you can see in this example, the quality score for the [Oranges] keyword has fallen from 4 to 3. Note that when there is not enough impression or click data, AdWords shows a blank value for Qual. score (hist.).
Depending on the exact situation, this could indicate changes in audience behavior, results from an ad copy test, tweaks to a landing page or something else entirely.
What’s important, however, is the fact that advertisers can use this data to identify when changes in Quality Score happened and then focus on what triggered those changes. As a result, these new columns should give advertisers a much greater ability to actively improve Quality Score.
My favorite part of Avner’s post, however, is the fact that these Quality Score columns should be available at the MCC account level.
If you’ve read many of my other articles, you know that I regularly track and analyze data from our more than 2,500 AdWords audits. In all those audits, however, we’ve never been able to see historic Quality Score data, which has always been a sticking point for me in my analyses.
Once these new columns become available at the MCC level (hopefully), I’m excited to really start breaking down the connection between Quality Score and AdWords performance (stay tuned!). With this new data, we should be able to clearly see how changes in your Quality Score translate into changes in cost-per-click, cost-per-conversion and cost-per-sale.
Overall, this new development holds a lot promise for AdWords advertisers. Assuming that this isn’t all smoke and mirrors, this update should shed a ton of light on a very poorly understood aspect of AdWords.
What do you think of these new Quality Score columns? Would they be something you would regularly use? How soon do you think Google will make this data available?


