How to Use Marketing Analytics to Optimize Your Site
by Jacob Baadsgaard • February 21, 2018
Ever wonder how people got to your site and what they do on your site? Marketing analytics are a great way to answer these questions and many more.
Fortunately, to set up and use marketing analytics, you don’t have to have a degree in statistics or even an on-staff web developer. Google Analytics is a completely free resource available for all sites.
It’s easy to install, and it gives you the kind of invaluable data about your site’s audience, content, and performance that can help improve your online presence tenfold. I do not say that lightly, and no, it’s not even a little bit of a hyperbole.
Most business know this and figure out how to install Google Analytics on their site quickly. Despite this, it’s still not uncommon for many businesses (including even marketing agencies) to not realize how to use the tool properly. They may not know the depths of the information available to them, or how to use that data to optimize their site.
These businesses may have Google Analytics, as it turns out. They just don’t know how to use the marketing analytics data Google Analytics gives them.
That’s about to change. In this post, you’ll learn how to use Google Analytics to guide your marketing decision, including what you can learn about your site, how to evaluate your PPC campaigns’ true effectiveness, and how to implement this data.
What You Can Learn from Marketing Analytics
A good marketing analytics setup can tell you so much that it can be difficult to know what information to prioritize and what to focus on. Ultimately, you want to be looking for key performance metrics (KPIs) that give you a full diagnostic picture of your site’s performance.
Here’s some of the things you should be watching most closely…
What’s Bringing Users to Your Site?
You need to know what channels and campaigns are sending the most traffic to your site. This includes figuring out which keywords are most helpful. You’ll also want to use your marketing analytics to identify which sources are sending you the best and most relevant traffic.
Under the Acquisition tab in Google Analytics, you’ll be able to see both general and specific information about which channels are sending you the most traffic.
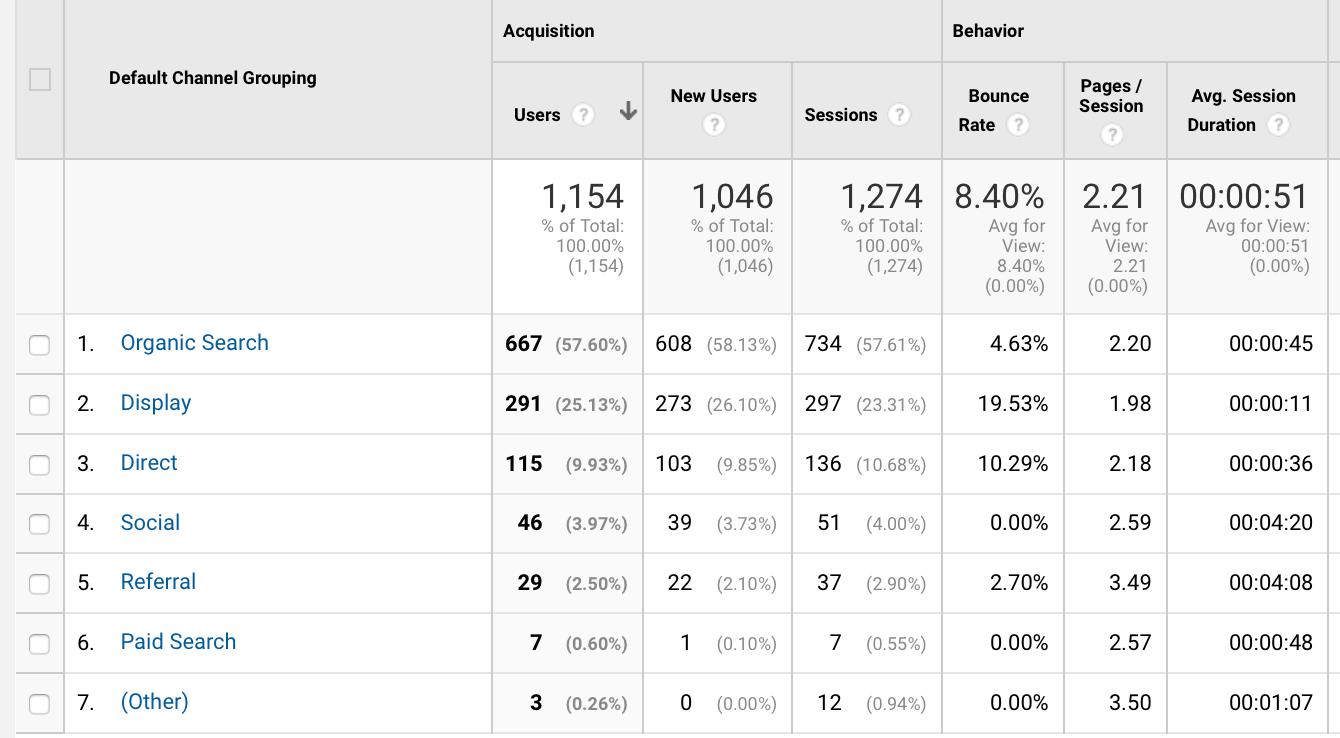
Once you have this information, you can then evaluate which channels are most valuable to you.
Maybe you’ll find that your mostly-free content marketing platform is getting you significantly more results than the $500 a month you’re spending on PPC campaigns. Or, maybe you’ll discover that Facebook Ads gets you significantly more conversions than AdWords, or that they send you users who spend significantly longer on the site or view more pages.
Time spent on the site indicates relevance and interest, so that shouldn’t be overlooked.
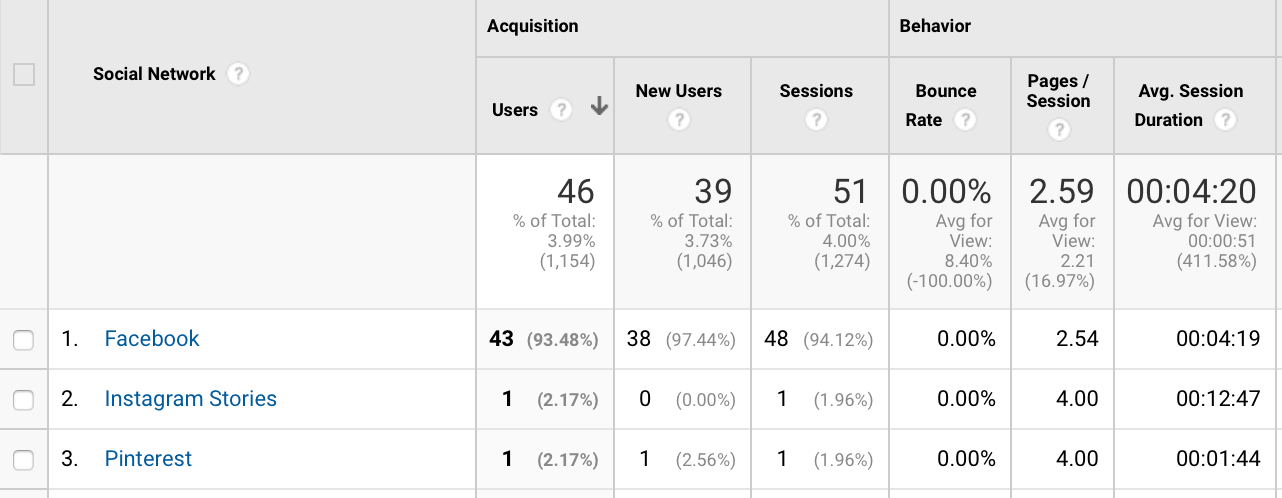
You can then put more of your money and time into optimizing your site for the channels that send you the most and the best traffic.
Who is Coming to Your Site?
Getting a better of understanding of who is actually coming to your site can also be valuable. Maybe you’ll learn something new about your target audience, like realizing a niche that you hadn’t recognized before. Or, it’s possible to discover that you might be getting people to your site who aren’t quite a good fit.
That’s the power of marketing analytics.
Under the Audience tab in Google Analytics, you can learn everything from your audience’s location, demographics, interests and behavior.
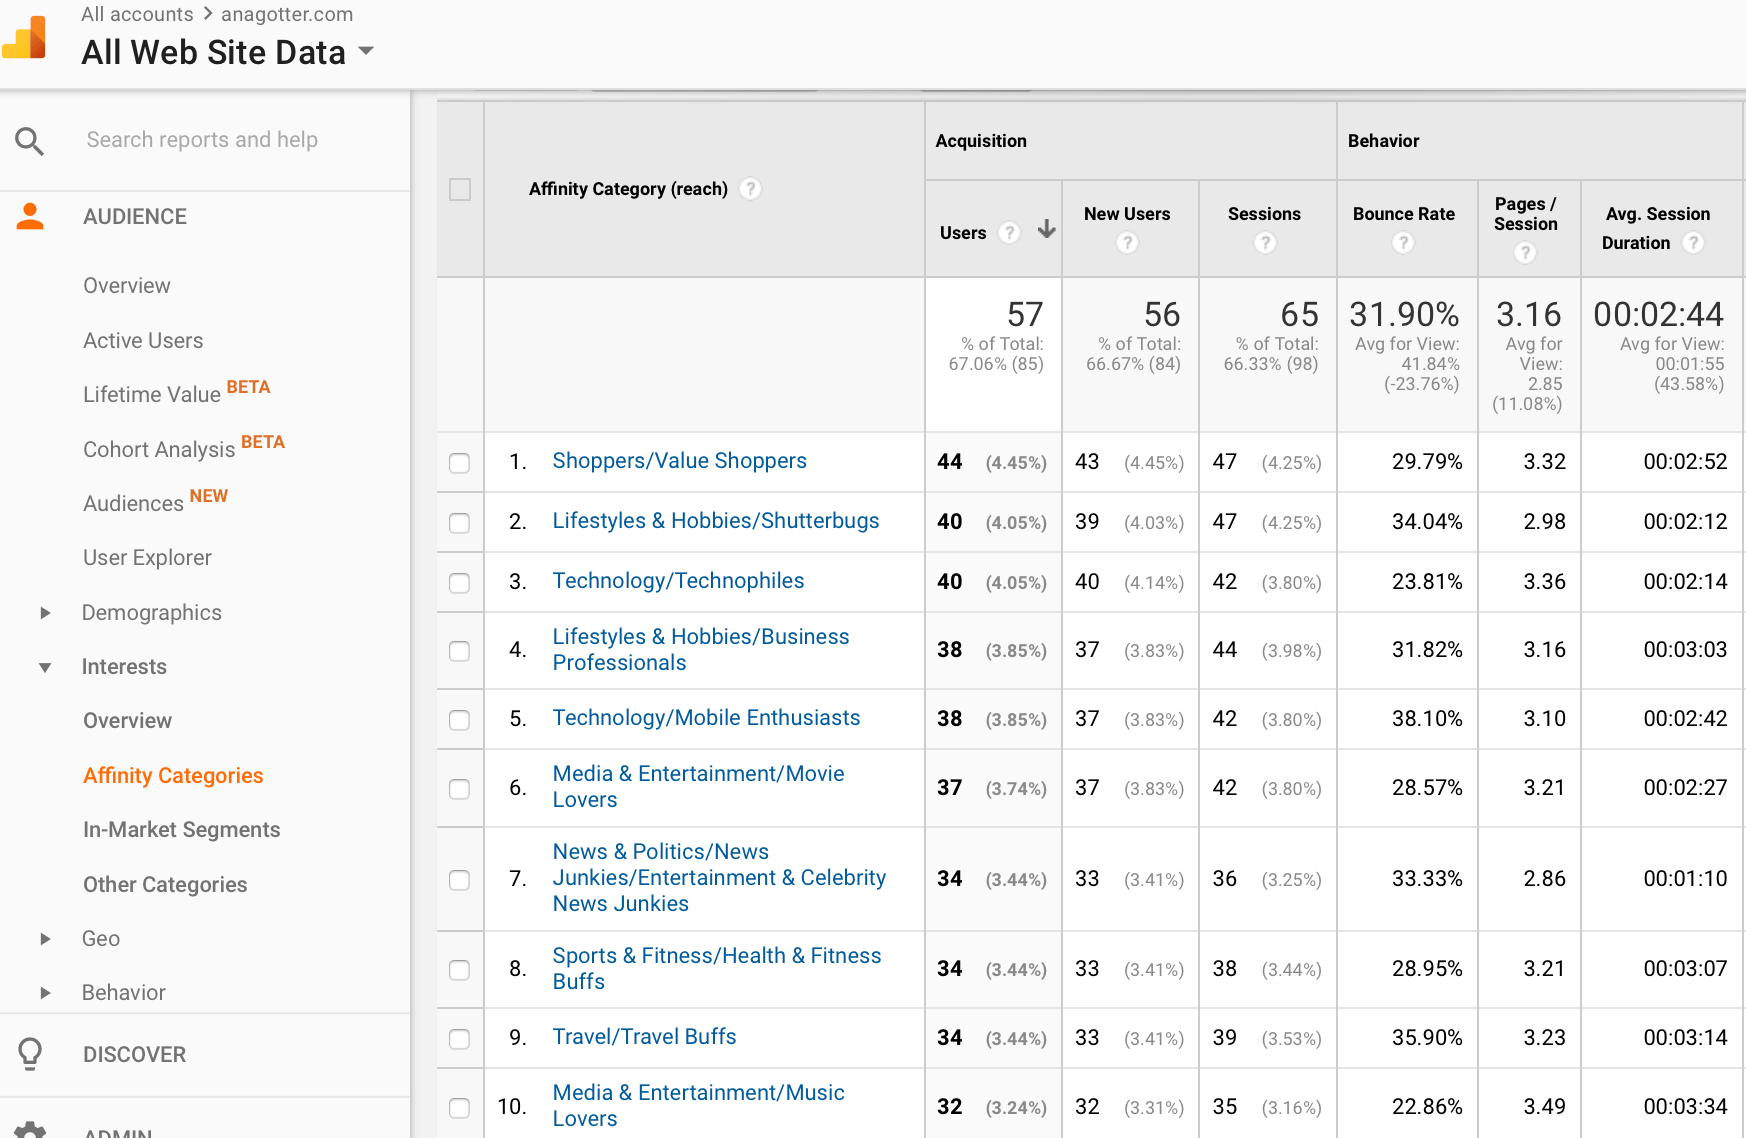
When examining each section and niche within your audience, you can also see which audience segments are most valuable to you. Which are staying on your site longer, and which have high return rates?
With this information, you can create more targeted campaigns, including both pay-per-click ads and content that’s designed to attract specific niches within your audience.
Is Your Site is Mobile Responsive?
Underneath the audience information tab, you can also spot some crucial design or responsiveness errors on your site if you look closely enough.
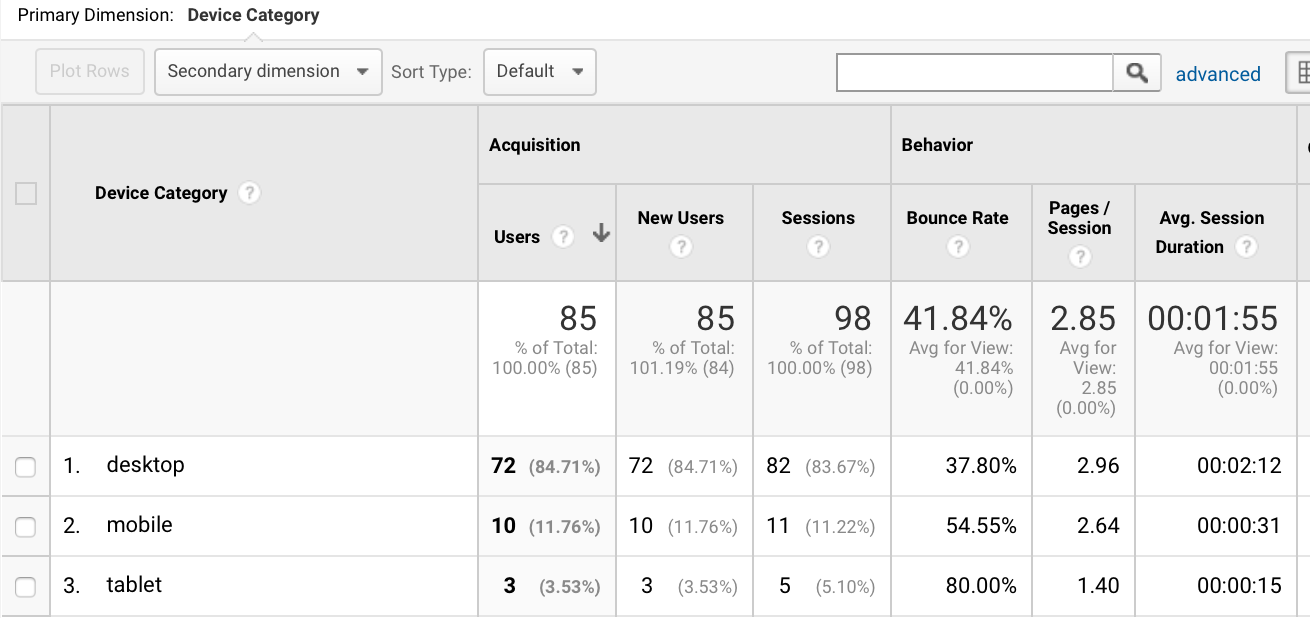
If, for example, your desktop site stats were excellent, but you saw higher bounce rates and lower session duration times on mobile, that could indicate that your site isn’t mobile-responsive.
How Do Users Move Through Your Site?
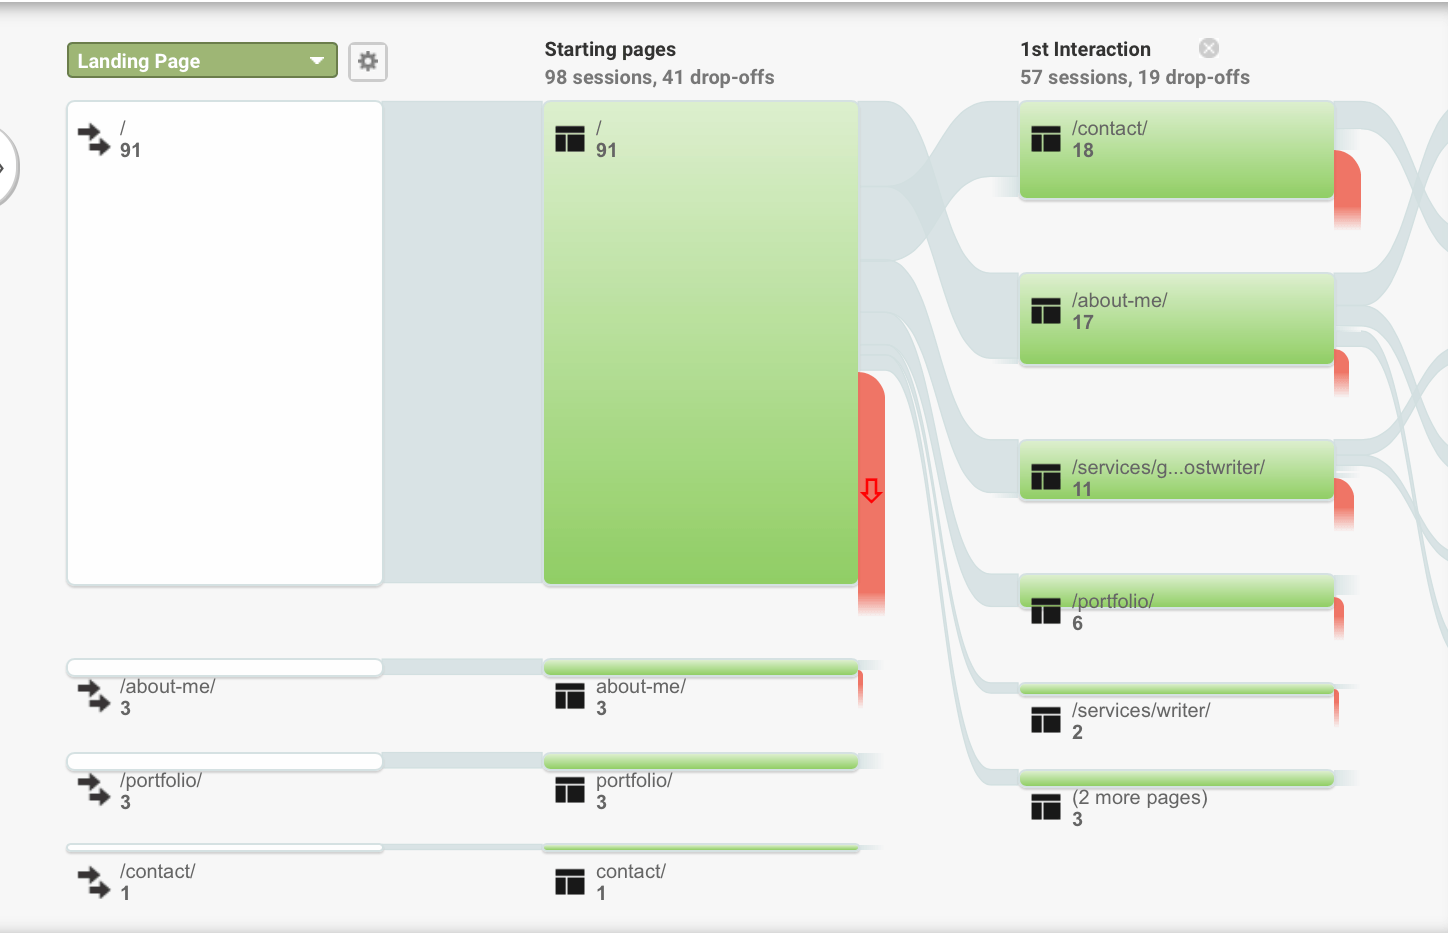
If you want to get a firm understanding of how users are moving through your site and which touch points are most effective at bringing in and keeping traffic going, check out the Behavior section of Google Analytics.
Under the Behavior Flow tab, you can see which pages send users to different destinations on the site and where they commonly exit the site. This can help you determine what copy is most effective at selling and which CTAs work best.
Under the “Site Content” tab, you can also select “All Pages” for more exceptionally valuable data. You can see which pages are bringing in the most entrance traffic and which hold the most monetary value in terms of driving conversions.
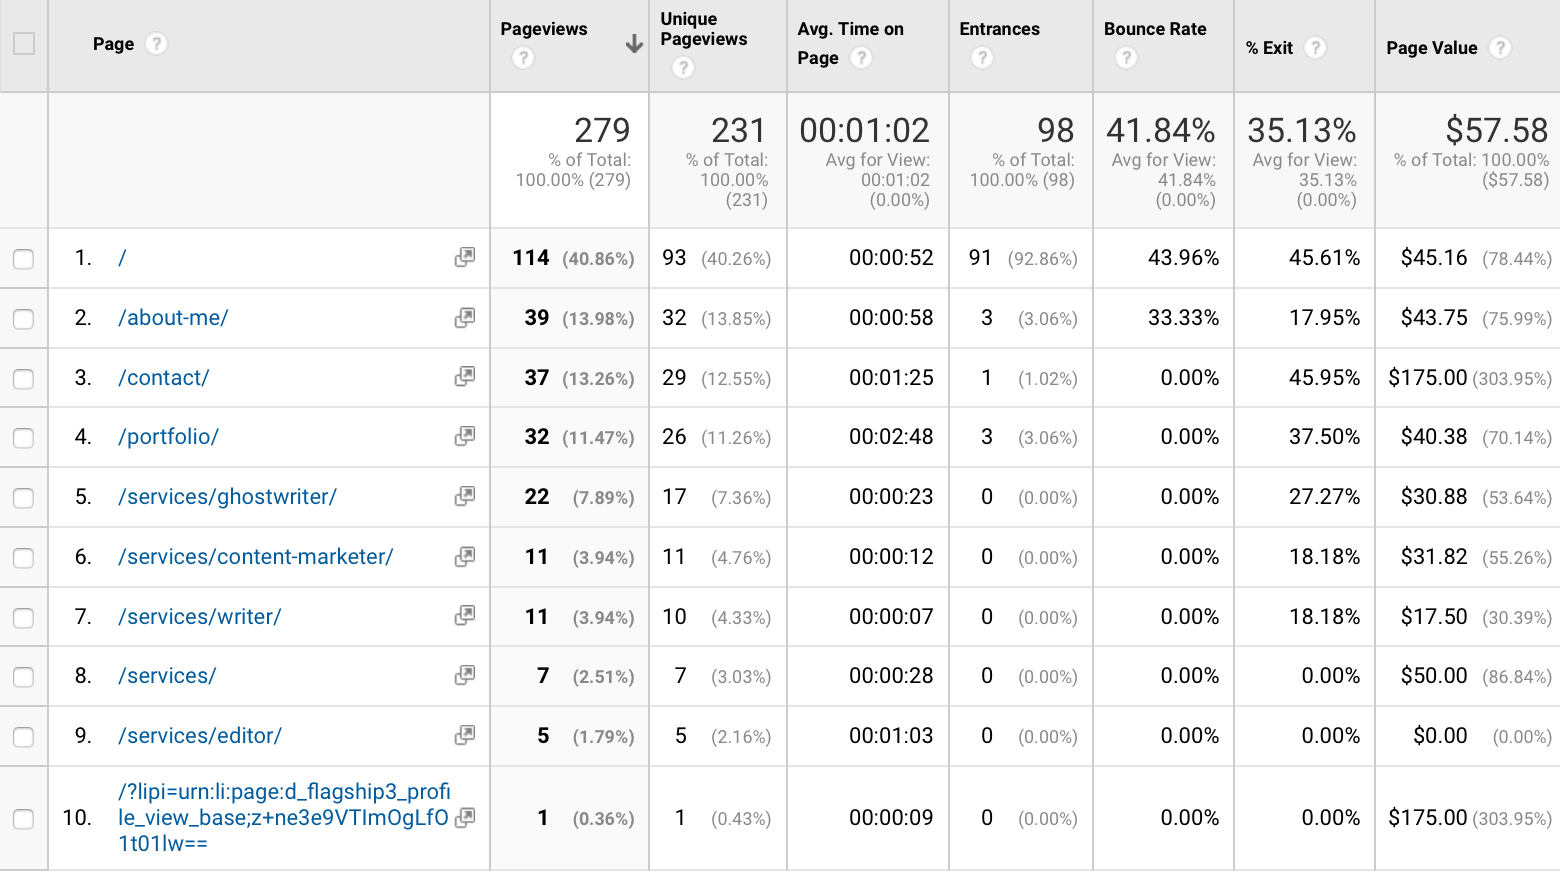
Use this information to optimize your site by putting your most valuable pages in more visible locations in the navigation bar and by regularly updating them with new SEO best practices to keep more traffic going towards them.
Is Your Audience Converting?
Sure, you’ll absolutely be able to tell whether your audience is converting or not based on the income and payments coming in through your site. Marketing analytics can give you a lot more information about who is converting and what prodded them to do so.
You can set up goals, including trackable funnels, that track users through the path on your site and to the inevitable check out or “thank you for your purchase” page.
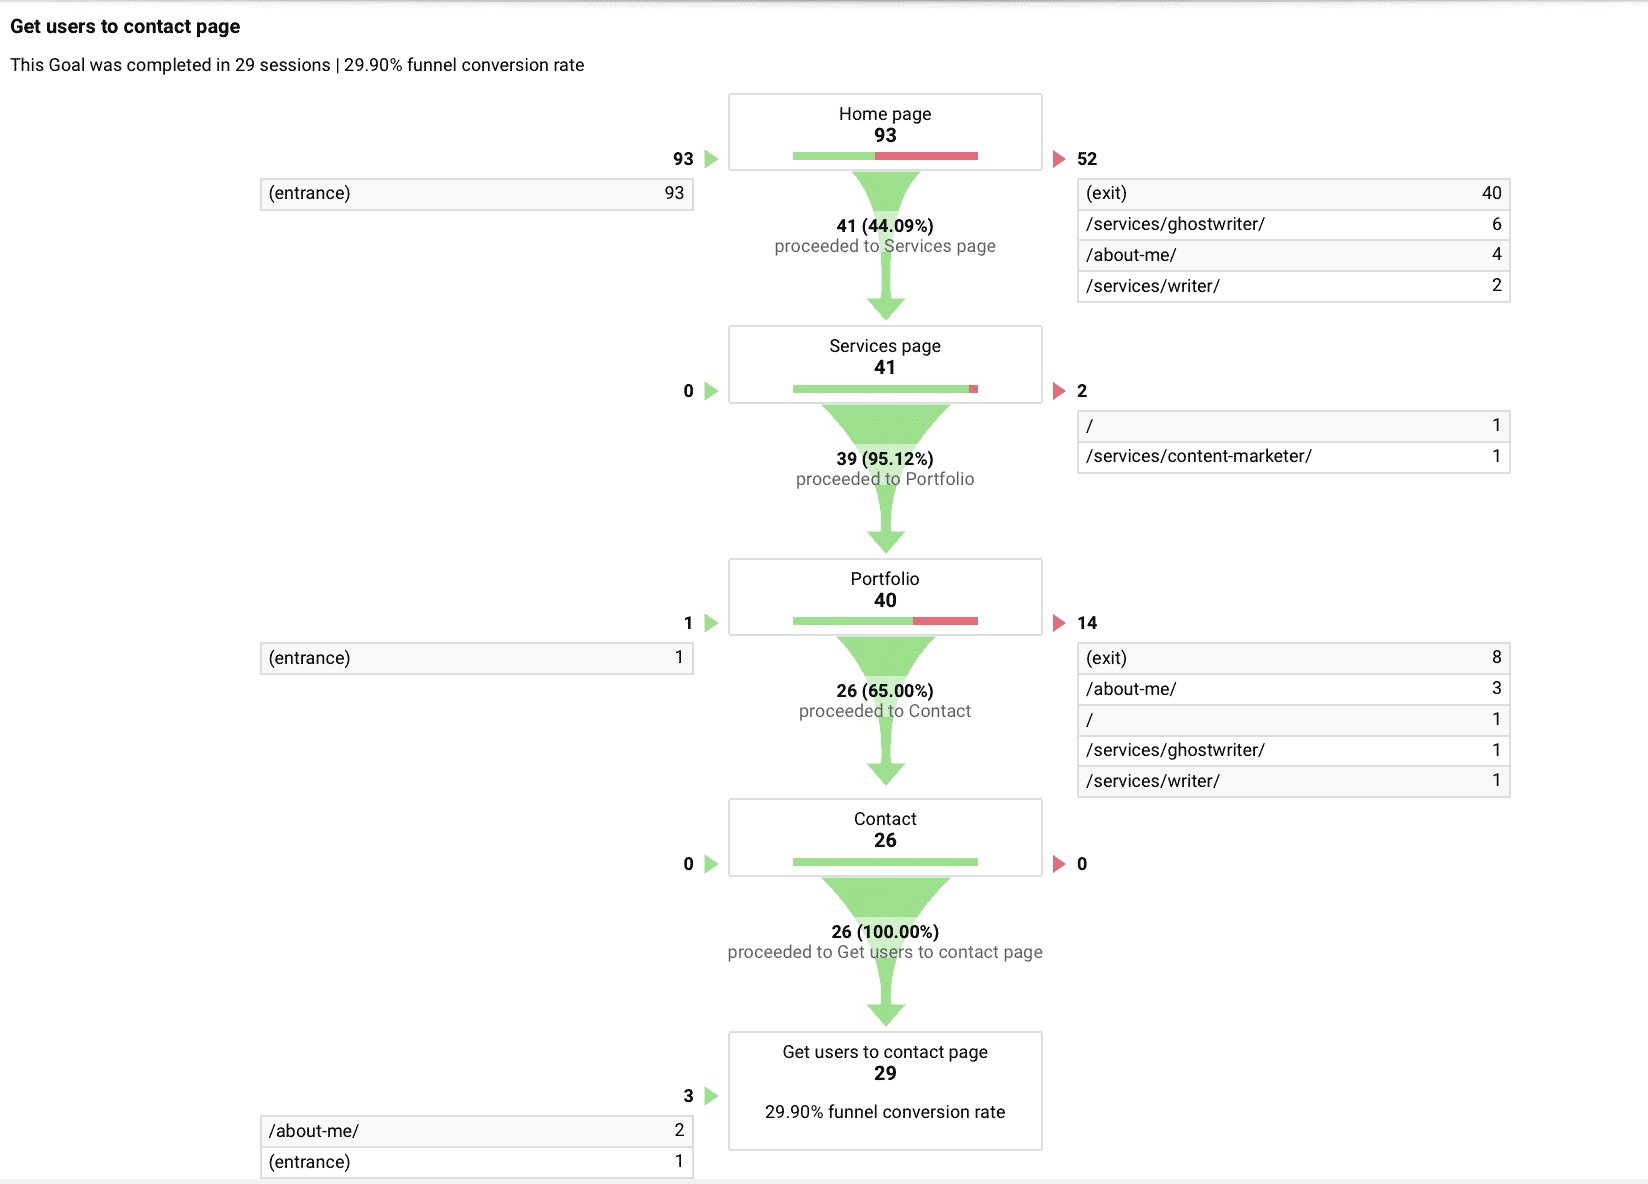
Combine this knowledge with the data you’ve found from above, showing you which audiences, traffic channels, and site navigation patterns are most profitable for you. Rework your site as needed, giving priority to the content and pages that earn you the most sales.
What You Can Learn from Your AdWords Results
Google AdWords has their own separate dashboard where they’ll show you details on metrics like CPC, clicks, CTR, and numbers of conversions. That’s all helpful, but taking a look at how your AdWords campaigns and ad groups perform in Google Analytics can tell you a lot, too.
You can, for example, get insight into your most high value keywords. You can do this by going to Acquisition, then AdWords, then Keywords or Search Queries.
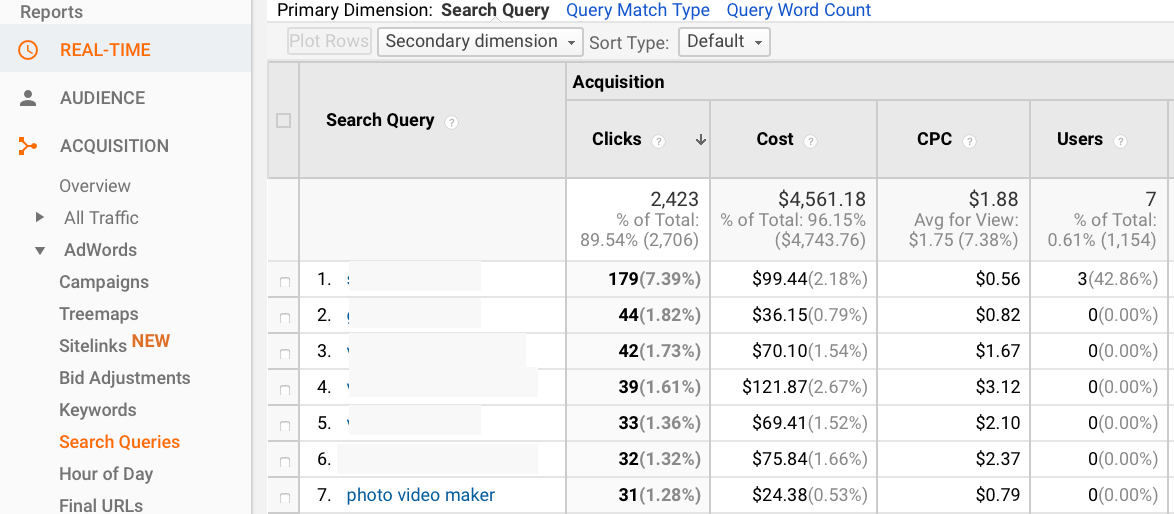
You’ll be able to see which keywords got you the most clicks at what cost, and how many different users engaged with them.
You can use this to not only improve your AdWords campaigns, but also to improve your own organic SEO content. After all, people would much rather click on organic content than ads, so target your most high value keywords with new content or sales pages to get better organic results moving forward, too.
Conclusion
Google Analytics is a tool that every single website should be using. It’s free and easy to both install and use, making it accessible for everyone. By looking at specific KPIs to look for particular sets of data, you’ll be able better interpret the information that Google Analytics can provide you.
You’ll be able to get a much better understanding of how your site, marketing campaigns, and content have all come together to help your audience find you and convert and how you can optimize it moving forward.
By the way, if you’d like help setting up Google Analytics or using your marketing analytics data, let me know here or in the comments! I’d love to help
What do you think? Do you use marketing analytics? How about Google Analytics? Which KPIs and goals do you focus most on? Do you have any questions about how to use Google Analytics? Let us know in the comments below!


